Tutorial on Stochastic Indicator
Post on: 16 Март, 2015 No Comment

What is Stochastic Indicator?
This is an another type of Oscillator developed by George C. Lane. It is a momentum indicator. This is used to identify the extreme prices range (higher and lower) over a period of time.
Components of Stochastic Indicator
The Stochastic indicator consist of two parts namely:
1.% K indicators line: This can be calculated by having a recent close price, highest price and lowest price over a period of time (days). Default is 14 days or also known as 14 period.
2.% D Signal line: This is the moving average of % K. Default is 3 days or 3 period.
Depending on the individual traders need and interpreting data one can use other periods also like intraday. week, months etc. But better performance of this indicator is seen with default setting with less false signals.
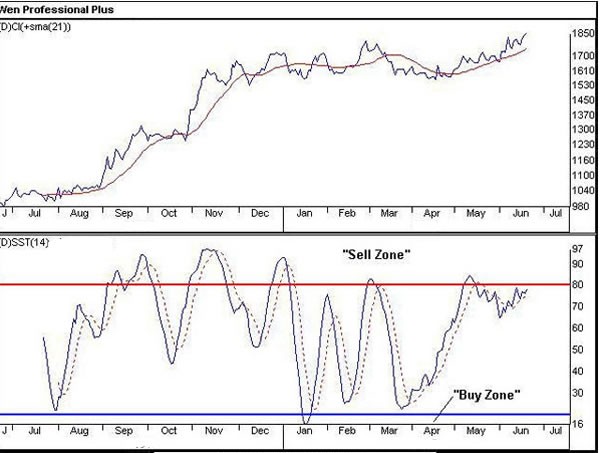
Stochastic indicator oscillates between 0 to 100 range. Accordingly the overbought (Accumulation) and overbought (Distribution) levels can be determined. Above 80 is considered to be Overbought and below 20 is considered to be oversold levels.
Types of Stochastic Oscillator
There are three types of Stochastic Oscillator namely:
1.Slow Stochastic Oscillator
2.Fast Stochastic Oscillator and
3.Full Stochastic Oscillator
The former two i.e. Slow and fast are more common then the later i.e. full stochastic indicator. Though all the three types signals gives the same indication, one is more sensitive over other. Or you can say one is more complicated then the other.
Therefore fast stochastic is more sophisticated giving a lot more information over slow stochastic which may be very useful in picking stock and screening the false signal. A full stochastic is a combination of slow and fast stochastic and provide a lot other advance information, which people thinks its very confusing and for other traders its very useful.
The most common stochastic indicators among traders are slow and fast stochastic. Here in this website also we are providing Stock Screening based on slow and fast stochastic indicator.
How to Incorporate Stochastic Indicator in Trading?
Traders can use Stochastic Indicator in a number of ways to enhance the quality of stock picking and finally to increase the profit. Below are few mentioned ways:
1. Overbought and Oversold levels: Stochastic indicators are most popularly used for finding the overbought and oversold levels of the stock. Stochastic below 20 is suggested as an oversold condition which gives a signal of better buying opportunity while Stochastic above 80 is an indication of overbought level and a trader may pay attention in selling their open position.
Always take precaution and remember this indicator works better in sideways market rather than in trending market Some times the overbought period is very long indicating an uptrend .
2. Divergence: Divergence in stochastic indicators also gives buy and sell signal called positive and negative divergence and they also serve as a reversal signal.
a. Negative divergence in stochastic is defined as when in overbought condition(Above 80) the % D Signal line makes a lower highs and the stock price makes higher highs, resulting in negative divergence which indicates a sell signal. Negative divergence signals a possible downward reversal is due. This is also called as bearish divergence.
b. Positive divergence in stochastic is defined as when in oversold(Below 20) condition the % D Signal line makes a higher lows and the stock price makes lower lows, resulting in positive divergence which indicates a buy signal. Positive divergence signals a possible upward reversal is going to occur that’s the reason it is also known as bullish divergence.

3. Crossover: Stochastic lines crossover in a number of ways to gives a number of indications, a trader may utilize to interpret into some meaningful information which further helps in making a confident decision.
a. Crossover with Center Line: Stochastic Indicator % D Signal line when crosses the center line a bullish signal is indicated, similarly when it crosses below the center line a bearish signal is dictated.
b. Crossover Between % K Indicator Line and % D Signal Line. Traders also uses % K Indicator Line and % D Signal Line crossover as a indication of buying and selling signal.
When the % K Indicator Line crossovers % D Signal Line such that % D Signal Line is above the % K Indicator Line in the overbought area, indicates a sell signal.
And if the % D Signal Line crossovers % K Indicator Line such that % K Indicator Line is above the % D Signal Line in the oversold area is an indication of buy signal.
Precautions While Using Stochastic Indicator
Stochastic indicators give pretty descent buying and selling signal however a traders has to pay attention what is going around, in the market and has to add few more indicators like volume etc. when using Stochastic as a precaution to avoid any false signals.
How to Calculate Stochastic Indicator:
Traders don’t have to calculate the Stochastic Indicator as there are number of free tools available online which calculate Stochastic Indicator. Traders can change the period time if they wish to. However it is mentioned the typical defaults settings of % K (14 Days) and % D (3 Days) gives the better signal then others.
Where (n) is the number of period or can say days usually 14 Days/Period)
% D = Moving average of % K (usually 3 Days/Period)
Our website provides free Stock screening based on Overbought/Oversold conditions. It can be found at:


