TRIN Index 4 Simple Steps to Make a Better TRIN Index
Post on: 1 Июнь, 2015 No Comment

Last updated: Friday 4 July 2014
The TRIN Index is one of the few truly leading indicators.
The TRIN Index, also known as the Arms Index or Trading Index, was developed by Richard Arms in 1967 and since then has become one of the best-known indicators of stock market strength. Today, TRIN Index data is available for both the NYSE and NASDAQ markets.
The original (but flawed) TRIN Index formula
At the time, the idea was revolutionary. By combining four non-price variables in a very simple formula, a single number could be generated that indicated whether market internals were bullish or bearish. The original formula for the TRIN Index is as follows:
Problems with the TRIN Index
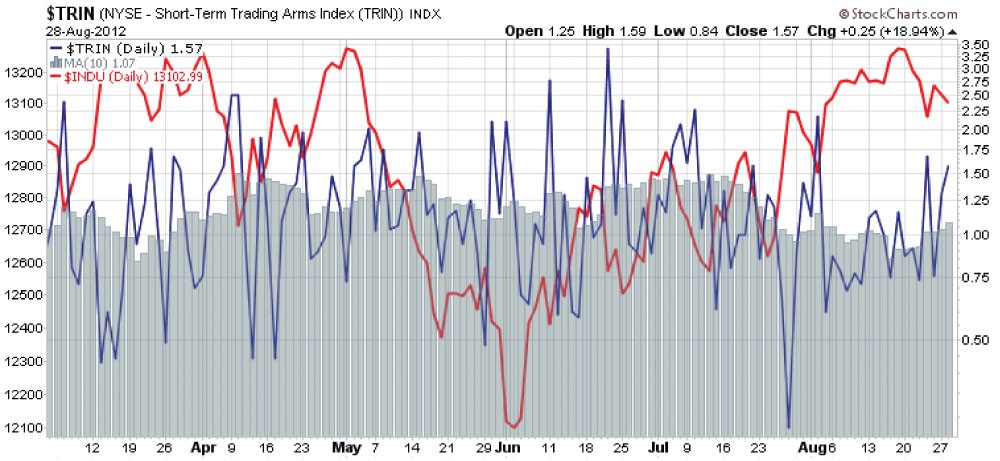
TRIN Index Raw Data on an End of Day Chart
A chart of the raw NYSE TRIN data is shown above. As revolutionary as the TRIN Index was, there are some problems with it:
Problem #1: TRIN is not an intuitive value
Values above 1 indicate that there is selling in the market. Values less than 1 point toward more buying activity. For greater clarity, a high number should mean that the market is advancing; a low number would indicate that the market is in decline.
Problem #2: TRIN values are unbalanced
If stocks are bought and sold at equal rates, the TRIN Index value is 1. But after a day of heavy selling, the TRIN could be as high as 3. Similarly, the TRIN could dip to 0.3 after a day of heavy buying. When charted over time, the result is a graph with high spikes but shallow dips. See the chart above.
Problem #3: TRIN averages are inaccurate
Traditionally, traders average TRIN data over 10 days. Any value under 0.8 represents an overbought market, while a value of over 1.2 indicates that the market is oversold. But because the data is lopsided to begin with, this average is a faulty calculation at best.
Creating a Better TRIN Indicator
Its been 40 years since investors first began using the TRIN Index as a market measure. Can we do better? Yes! By making some simple mathematical adjustments in your charting software, the result is an adjusted or Better TRIN that is easier to interpret and more accurate when averaged.
Heres what to do to create a Better TRIN Indicator:
- Take the Log of the NYSE TRIN value
- Invert this value so negative values are positive and vice versa
- Multiply the inverted Log value by 100, and
- Repeat for the NASDAQ TRIN data and average the two values
Interpreting the Better TRIN Indicator
20TRIN%20image.gif /%
Better TRIN Indicator with the Emini
The chart above shows what the adjusted or Better TRIN Indicator looks like. Now, the TRIN makes more sense to me!
If you have successfully followed the steps above, the Better TRIN Indicator is easy to interpret at a glance and gives you a better idea of market trends when averaged.
- Values range between -100 and +100, with 0 as the neutral point.
- Positive values indicate buying and a market in an upswing.
- Negative results indicate selling activity and downward moves in the market.
- Values are balanced, requiring the same amount of buying or selling for the indicator to be +100 or -100 and, therefore, averages are accurate.


