Trends In Gold Option Volatility
Post on: 7 Июль, 2015 No Comment

Summary
- This period of growth in option use has coincided with the rapid rise in the gold price after the 2008 credit crisis.
- A key benefit of having a liquid and actively traded option market is the market information that can be discerned from option prices.
- In this week’s commentary we look at a ten year history of gold option prices and highlight some of the key characteristics evident in the data.
Treesdale Partners, portfolio manager of the AdvisorShares Gartman Gold/Euro ETF (NYSEARCA:GEUR ), AdvisorShares Gartman Gold/British Pound ETF (NYSEARCA:GGBP ), AdvisorShares Gartman Gold/Yen ETF (NYSEARCA:GYEN ) and AdvisorShares International Gold ETF (NYSEARCA:GLDE ), share their thoughts about the gold space.
Liquidity in gold option trading has risen significantly over the last five years. Using the COMEX 100 ounce gold option contract as a proxy for the market, Year-to-Date Average Daily Volume has risen from approximately 30,000 contracts in May 2009 to 70,000 contracts (
217 metric tonnes) in May 2014. This period of growth in option use has coincided with the rapid rise in the gold price after the 2008 credit crisis and perhaps reflected a need from the growing number of gold investors for derivative contracts with which they could manage the risks inherent in their gold exposure.
Source: CME Group
A key benefit of having a liquid and actively traded option market is the market information that can be discerned from option prices, giving an insight into the supply and demand dynamics of the market. In this week’s commentary, we look at a ten-year history of gold option prices and highlight some of the key characteristics evident in the data. We also look at the equity option market through the price history of the CBOE VIX index and draw parallels between the two option markets.
In this analysis, option prices are expressed in terms of implied volatility rather than dollars and cents. A key input into the calculation of option prices is a parameter called volatility. In effect, it is the market’s estimation of the amount of volatility (typically defined as the variability in daily moves) in the gold price that is likely to be experienced during the life of the option contract. In general, the higher the level of expected volatility, the higher the option price in dollars and cents. Volatility is typically expressed as a percentage on an annualized basis. For example, a one-year volatility of 20% would imply that the expected standard deviation of the gold price over the next year is 20%. Ultimately, expressing volatility in this way is useful as it allows direct comparisons of the potential movement in asset prices across different markets, as implied by option prices.
We highlight below some of the more interesting characteristics of the gold option market:
- The absolute level of volatility. Over the last ten years, the spot price of gold in dollars has had approximately the same level of volatility as a broad based large cap equity index (the S&P 500). It is perhaps worth also making the point that the volatility of gold bullion has been significantly lower than the volatility of a broad based index of gold mining stocks. For example, the historical volatility of the NYSE Arca Gold Miners Index (42% annualized) has been just over twice the volatility of the gold bullion spot price (20% annualized) as measured by daily price movements over the last 10 years. This point is worth remembering given the common practice of using gold mining equities as proxies for gold bullion. The two assets provide exposure to really quite different types of risk and this is reflected in the large difference in historical volatility
- Volatility is contagious. It is also noteworthy that implied volatility in the gold market has tended to track the movement of implied volatility in the equity market. This is noticeable particularly during periods of market stress such as in 2008 and 2011 where a spike in volatility in one market was mirrored in the other market. In fact, unsurprisingly, this is a phenomenon we tend to observe where significant declines and falls in volatility tend to be reflected across all markets.
- Volatility has fallen sharply in 2014. In synch with volatility in other asset classes, implied volatility in gold markets has fallen sharply in 2014 tracking the much lower day to day volatility in the gold price. The prior low in one month implied volatility was 10% reached in July 2005.

Chart 1: Absolute level and co-movement in gold bullion implied volatility versus CBOE VIX Index
Source: Bloomberg LP
A key metric that provides important information about the balance of supply and demand in the gold market is the implied volatility skew. A detailed discussion of volatility skew is beyond the scope of this article but broadly speaking the skew is a reflection of the market’s preference for owning gold calls (expectations for gold prices to rise) versus gold puts (expectations for gold prices to fall). When the price for a given out-of-the-money gold call as indicated by its implied volatility is higher than the price for an equivalent gold put, the skew is said to be positive meaning that the market demand for gold calls exceeds the demand for gold puts and as such the market clearing price for gold calls is higher.
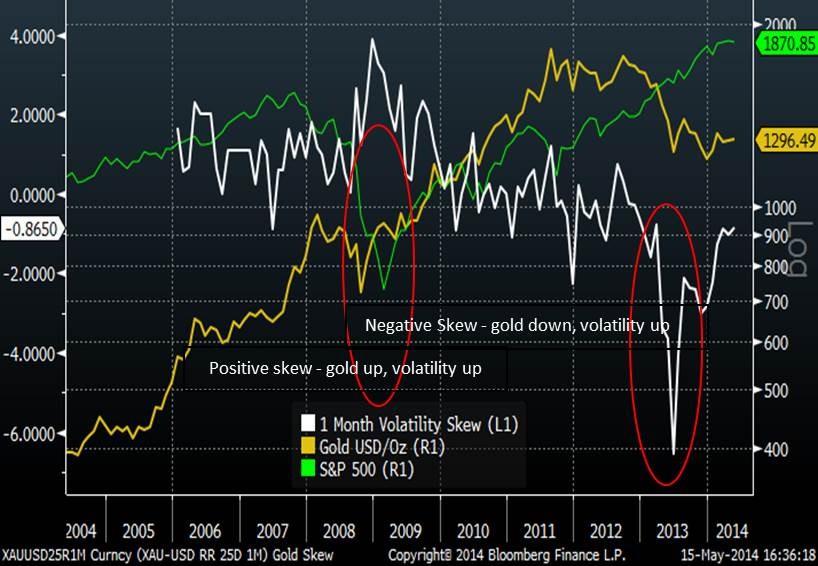
In the following chart, we plot the gold implied volatility skew. The specific metric we plot is the difference between the implied volatility for a one-month gold call with a strike price that has a 25% probability of being exercised (at inception) versus the implied volatility for a one month gold put with a strike that also has a 25% probability of being exercised. The benefit of defining the skew with reference to the probability of exercise is that it standardizes the price units and as such allows the skew to be compared across different option markets.
- The market preference for gold calls versus gold puts switched: A fundamental change that has occurred in the gold option market over the last ten years has been the switch in the skew from a preference for gold calls to a preference to gold puts. Prior to 2010 we can see that the skew had generally been positive (white line) but it swung sharply negative in 2012 and 2013 matching the move lower in the gold price. Gold historically has generally been seen as a defensive asset to hold in a portfolio. This meant that during periods of market stress, while the prices of assets such as equities might be expected to fall, the price of gold typically rose as investors sought out assets that were perceived to provide protection from falling markets. This characterization as a defensive asset was reflected in the positive implied volatility skew — in other words markets were willing to pay a premium for gold calls versus gold puts because of this diversification benefit that gold was expected to provide to a portfolio.
This has since changed and the last two years have been characterized by the gold skew being persistently negative i.e. markets are willing to pay a premium to own gold puts versus gold calls. It is perhaps no coincidence that the switch occurred during a period of rapidly falling gold prices. While we do not pinpoint one specific cause it seems likely that with the surge in gold speculation over prior years, as evidenced by the rapid rise in the gold bullion holdings of the most prominent gold ETFs, many investors sought to buy protection from falling prices via purchasing gold puts — in effect the balance of supply and demand switched very strongly in favor of gold puts. The sharp preference for gold puts experienced in 2013 has since moderated with the skew approaching balance (ZERO). While it is still too soon to say with certainty what the trend will be for skew going forward we would suggest that should there be rising demand for gold, driven for example by an escalating conflict in Ukraine, we would expect the skew to turn positive again, indicating a market preference for gold calls.
Chart 2: Gold Implied Volatility Skew
Source: Bloomberg LP
- S&P implied volatility skew: As a final observation we note that the S&P 500 Index implied volatility skew, in contrast to gold skew, has been persistently negative reflecting the premium that investors are willing to pay to own equity puts versus equity calls, as protection against falling equity prices. Whilst gold skew has been negative in recent years, the generally negative relationship between gold skew and equity skew could be interpreted as a measure of the markets’ value of gold’s potential portfolio diversification benefits.
Chart 3: S&P 500 Implied Volatility Skew (lower chart white line)
Source: Bloomberg LP S&P 500 Index (green line, left hand axis);
Gold Implied Volatility Skew (lower panel, white line)
Skew is defined as the implied volatility of a gold call with a 25% probability of being exercised minus the implied volatility of a gold put with a 25% probability of being exercised
Disclosure: I have no positions in any stocks mentioned, and no plans to initiate any positions within the next 72 hours.
Business relationship disclosure: AdvisorShares is an SEC registered RIA, which advises to actively managed exchange traded funds (Active ETFs). The article has been written by Ade Odunsi, portfolio manager of the AdvisorShares Gartman Gold/Euro ETF (GEUR ), AdvisorShares Gartman Gold/British Pound ETF (GGBP ), AdvisorShares Gartman Gold/Yen ETF (GYEN ) and AdvisorShares International Gold ETF (GLDE ). We are not receiving compensation for this article, and have no business relationship with any company whose stock is mentioned in this article.
Additional disclosure: To the extent that this content includes references to securities, those references do not constitute an offer or solicitation to buy, sell or hold such security. AdvisorShares is a sponsor of actively managed exchange-traded funds (ETFs) and holds positions in all of its ETFs. This document should not be considered investment advice and the information contain within should not be relied upon in assessing whether or not to invest in any products mentioned. Investment in securities carries a high degree of risk which may result in investors losing all of their invested capital. Please keep in mind that a companys past financial performance, including the performance of its share price, does not guarantee future results. To learn more about the risks with actively managed ETFs visit our website AdvisorShares.com .


