Trading Systems VI A tango with Point and Figure charts
Post on: 16 Март, 2015 No Comment

15.1 About Point and Figure Charts
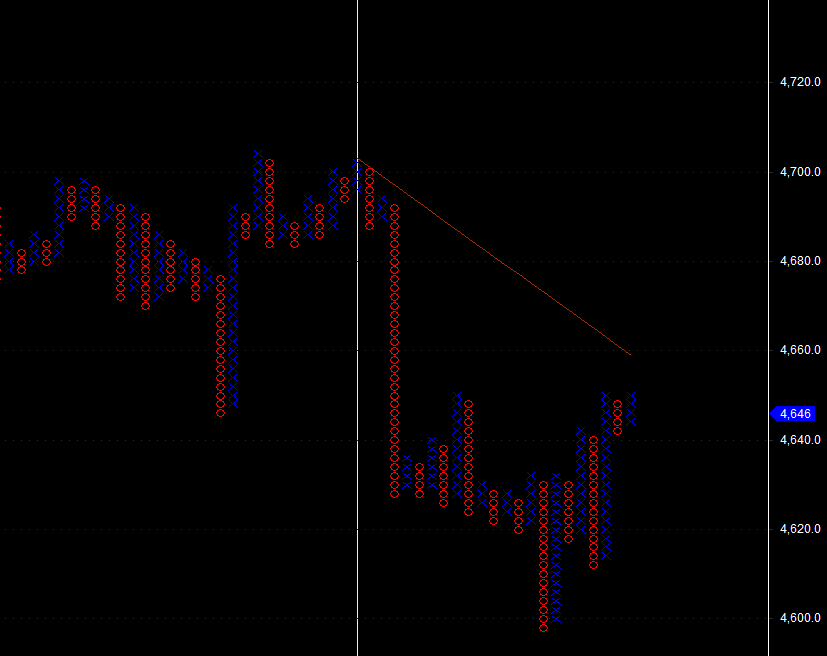
Unlike all other charting methods, point and figure charts do not have a time axis, as these are formed purely out of price action.
In its basic form, a column of X’s are drawn whenever price rises above a pre-defined range, but never when its within that range and a column of O’s are drawn whenever price falls, but never within that range.
Because of the asymmetric approach in the construction of the X’s and O’s, called the reversal, a new column is constructed only when price reverses more than 1,2,3 or more units of the predefined range, also called a box.
This last construction twist, creates a unique property in these charts, that a good amount of market noise gets cancelled and the charts give more cleaner trading signals.
The analysis platform that can be used is Bulls Eye Broker, currently v 4.0 with v 5.0 on the way.
I use it by letting it feed off data stored on my primary platform Amibroker. That has a small but acceptable limitation of needing to refresh the charts to see new price movements.
There are experts who have written AFL’s to implement PnF charts on Amibroker, but these are not complete in capturing all the principles of PnF charts. Its better to use a dedicated platform, if you really want to succeed. (I have now implemented an exact representation of PnF in Amibroker with more effective usage than a standard platform because of the flexibility available).
Trading signals with PnF charts are constructed by the formation of double tops (higher highs or lower lows) and other patterns like triple tops, catapults and breakout formations. With much of the noise removed, a right selection of box size and reversal choice can help you observe the larger price movement much more clearly.
You can plot averages, RSI and other indicators on these charts as well, but the basic charts are quite effective by themselves.
In 2 box reversal and higher, the 45 degree line drawn on the charts represents a unique trend determination line. Price movement above such a line is an uptrend and below that signals a downtrend. In sideways movement, this line continues to reflect potential trend formations.
One of the most objective uses of PnF charts is their ability to forecast target levels based on the amplitude of an upthrust or downthrust or the horizontal width of a breakout.
There are TA practitioners who call PnF charts as useless mumbo jumbo, because they cant do without the time line in a chart. But those who have perfected the use of the basic PnF charts, dont talk about it and continue to make effective use of it.
The lack of the time axis is not a limitation; it helps to show real price action without the noise that time helps to create! Time labelling can be put in by writing the date at the start of a new day and at the first movement of X’s and O’s. (or a week, or an hour or a month or a year!). Likewise, volume is a useful addition as in all other charts. Changing box size and reversal boxes simulates charts seen in different timeframes in the conventional approach using timelines.
Read more about Point and Figure Charting in the references at the end of this section.
Pros and opportunities:
Trading becomes less noisier, as you can vary the sensitivity of the charts through a combination of box size and reversals.
With 2 box and higher reversals, the 45 degree line is a natural support or resistance line. However, its better to use risk management based SL’s to optimize your profits.
Helps you to project potential targets, but not the time, as there is no time axis.
You can improve accurancy of conventional trading systems by plotting them on PnF charts. Of course the current platforms dont allow you to write scripts like Amibroker and others. Some of these are demonstrated (link given above).
Disadvantages: Not many practitioners in India.
Opportunity: Many innovations possible in your trading style.


