Trading Strategies Fibonacci Retracements
Post on: 7 Август, 2015 No Comment

Last week I wrote about various trading strategies, one I did not mention was Fibonacci Series or Ratios. Fibonacci series is a simple series of numbers in which its application is nearly limitless. It was created in 1202 by Leonardo Fibonacci, it has been evolving or expanding ever since. The Fibonacci ratios can be found in nature, in things such as ferns, seashells, hurricanes as well as many man-made things such as the pyramids in Egypt and the Parthenon in Greece. It is also used to find support and resistance levels in individual stocks and market indexes and can help determine when a price reversal is coming. Its is an interesting concept and much information can be found online for those of you wanting to delve deeper into it.
The Fibonacci series is a self replicating sequence of numbers. It starts with 1, 1, 2, 3, 5, 8, 13, 21, 34, 55, 89, 144, and so on to infinity. The numbers in this sequence have these properties:
- The sum of two adjacent numbers in the sequence forms the next higher number in the sequence.
- The ratio of any two consecutive numbers approximates 1.618 or its inverse, 0.618 (after the first few numbers).
- The relationship between these numbers is what gives us the common Fibonacci retracements pattern in technical analysis.
Why does Fibonacci work in the stock market. Because of investor perception. Perception is created by the collective mind of investors about what is overvalued, undervalued or fairly valued and that perception is ultimately reflected in the price of a stock or the market indexes. What investor or trader does not use a chart to visually understand what a stock or index has been doing and help determine when to buy or sell? Fibonacci retracements are used to indicate areas of support or resistance at the key Fibonacci levels before the stock continues in the original direction.
When using Fibonacci the general premise is to sell against resistance and buy against support.
Im not getting into the mathematics of it, I just want to cover how it is used in stock trading. Fibonacci retracements often occur at three levels: 38.2%, 50%, and 61.8%. The 50% is really not a Fibonacci level but it is used in stock trading because stocks have a tendency to reverse after retracing half of a previous move.

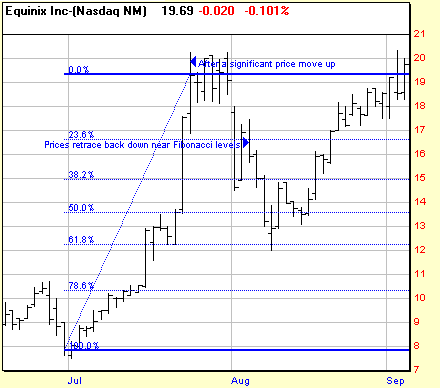
This picture gives you a graphical representation of the reversal points for stocks in an uptrend. The pattern is reversed for stocks that are in down trends. As a trader once the pullback begins you can plot these levels on a chart to look for signs of a reversal.
When plotting these levels on a chart you start by putting a line from the swing point high and the swing point low. Calculate the range from the high to the low price then multiply the range times a Fibonacci ratio: 38.2% (0.382), 50% (0.500), and 61.8% (0.618). Finally, subtract that number from the swing point high and you will have your Fibonacci levels.
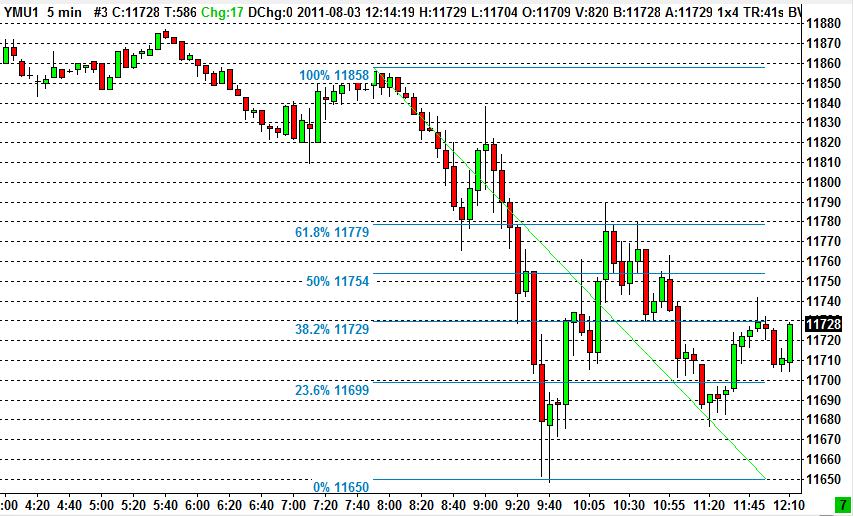
Here is a chart I found at stockcharts.com showing the Fibonacci levels. Notice how the price makes its high and starts to pull back, the reversal or retracement starts. You should also take notice of the candlesticks from the high.
- There are three black candlesticks with a wide range body making lower highs and lower lows, the next candlestick shows sellers are still in control of the stock but because of the narrow range in the body they are not as aggressive.
- The next day a white, wide range candle engulfs the body of the previous candle and closes near the top of the range.
- This is a buy signal, buyers are ready to take control of the stock, remember investor perception, this happened at the 50% retracement level.
Fibonacci levels are very versatile as well as accurate. They can be applied to various sectors of the market, indexes, commodities and the currency markets. It takes a little reading and practice, but you to could learn to use Fibonacci in your analysis and trading strategy.
As always whether you trade long or short may all of your trades be profitable!
3A%2F%2F1.gravatar.com%2Favatar%2Fad516503a11cd5ca435acc9bb6523536%3Fs%3D100&r=G /%


