Trading Stocks with the Bollinger Bands
Post on: 16 Июль, 2015 No Comment

Stock Trading with Chart Patterns
Trading Stocks with the Bollinger Bands
November 10th, 2011 Steve
Developed by John Bollinger in the 1980s, the Bollinger Bands are one of the most popular technical analysis indicators.
They are typically used to measure the location of price in relation to recent movements, but it differs than most indicators by taking volatility into consideration and its calculation. This article will explain how the Bollinger Bands indicator is calculated and will present tactical and practical methods of using it to improve your trading significantly.
- The Middle Bollinger Band is simple a 20-period Simple Moving Average = Average of Last 20 Closing Prices
- The Upper Bollinger Band is calculated by adding 2 standard deviations to the Middle band = Middle Band + 2 x SD
- The Lower Bollinger Band is calculated by subtracting 2 standard deviations from the Middle band = Middle Band 2 x SD
Standard Deviation is a statistical indicator that measures the average deviation of each number in a sample, from the average number. The higher the number, the more scattered the sample is, or the higher the volatility of the stock.
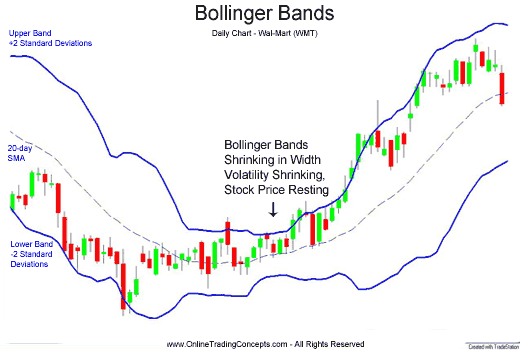
From this formula we can also infer that the more distant the upper and lower bands are from each other, the higher the volatility in the market:
Trading using the Bollinger Bands
As we have mentioned in the previous section, the Bollinger Bands are usually used to measure volatility. However, it is also possible to use them to signal and confirm trading signals:
Method #1: Support and Resistance
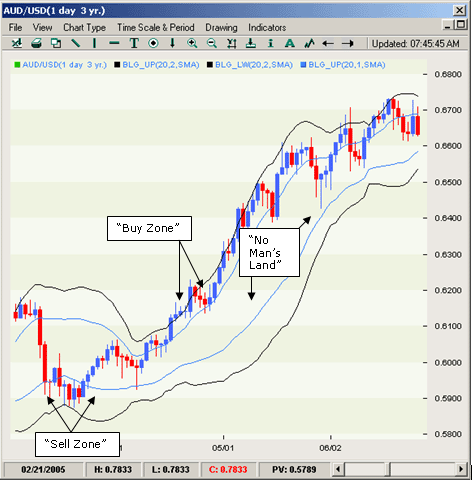
The lower and upper bands can be used as dynamic support and resistance levels, respectively.
Therefore if price hits one of those bands and begins to reverse, it can be a powerful reversal signal:
This kind of signals is particularly accurate in ranging markets, so it is important to confirm that the market is in range and NOT trending (this article explains all about trending and ranging markets).
It is also recommended to make sure that price has already reversed at least once at this price level, so it is a confirmed supportresistance level and not just a theoretic one. This leads to much more reliable signals.
Method #2: Breakout
The BB can also be traded when price breaks through them. As support and resistance levels, when price breaks through a band it may generate a strong trend that you can profit from:

However, this signal is less reliable than the reversal signal and we usually do not trade it.
There is one way that this signal transforms into a big profit opportunity. which we will explain in the next method: the Squeeze.
Method #3: The Squeeze
The Squeeze is a famous tactic for trading this indicator, and it can also generate quite impressive profits.
The Bollinger Squeeze occurs when price is trapped between the two bands and they squeeze the price in a period of very low volatilty. This usually results in a very big breakout that you can capitalize on:
One way to trade the squeeze is to prepare orders outside the squeeze, so they are triggered right as price breaks and begins the big move.
Bollinger and Chart Patterns
The Bollinger indicator can be used to confirm chart patterns and price-action signals. If you are entering a bounce trade, after price hits a trend line, you can check if there is also a bollinger band in the area. If this is the case, the signal will be more reliable and accurate.
You can also use the bollinger to anticipate a breakout. If you see that price is close to a certain supportresistance level and see that it is in a squeeze, it is highly likely that this level will be broken and you can enter an early trade based on that prediction.
BandWidth Indicator
Another indicator that is used in trading system development is the BandWidth. It is calculated using the following formula:
BandWidth = (Upper band Lower band) / Middle Band
Conclusion
In conclusion, the Bollinger Bands are one of the most popular technical indicators, and can give you a powerful edge at the markets. You have learned several tactical uses for it that you can start to use right now to improve your trading and increase your win rate.


