Trading Moving Averages
Post on: 24 Июнь, 2016 No Comment

One of the easiest to understand tools in investing is the moving average. Using a stocks moving average is a popular method of technical analysis, and can provide investors with insight into where a stocks price may be headed, and allowing investors to capitalize on a stocks momentum.
Trading Moving Averages: Common Uses
The most common uses for moving averages is to help you find a trend, and help you identify changes in that trend. They help smooth price action to make trends easier to identify. Simply put, the moving average is a stocks average price over time. The image below shows an example of this on a Dow Jones chart.
You can see this chart shows an up trend with a few dips along the way. There are two main types of moving average. A simple moving average (SMA) and an exponential moving average (EMA). Lets examine them both in more detail.
Simple Moving Average
I feel the best way I can explain a simple moving average is to say that it is the average price over a given period. You can set the period to be as long or short as you like.
For example a 20 period SMA will give you the average price for the last 20 periods. Moving averages can be used on any time frame you would like.
Each of the 20 prices is given an equal weighting with a SMA.
If you wanted to work out a SMA, it is calculated by adding all the last closing prices of the stock for the number of time periods you select, then dividing the number by the number of price periods.
The more time periods you select, the slower the SMA will respond to recent price movements:
The red moving average is for 20 periods and the light blue is for 50 periods. You can see how much slower it is reacting to the change in trend.
Exponential Moving Average
An exponential moving average is similar to a simple moving average. The difference is that the EMA places more weight on recent prices. The chart below demonstrates this:

The red line is the SMA and the light blue line is the EMA. You can see how the EMA has responded quicker to recent price action.
Moving Average Crossovers
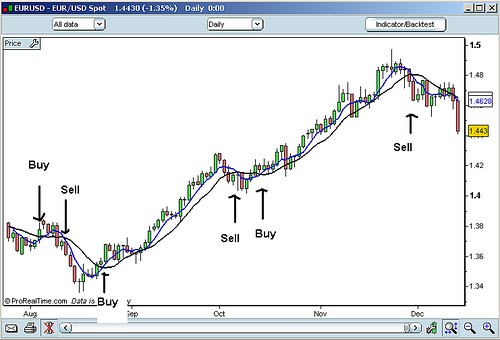
You can see in two of the charts above, two moving averages crossover each other.
Uses for Moving Averages
As mentioned earlier, one of the main uses for moving averages is to make it easier to identify trends, as well as any changes to that trend.
They can also be used as support and resistance. It is not uncommon for a securitys price action to bounce on a significant moving average, commonly the 50 SMA or 100 SMA.
They can also be used as part of a strategy. Some traders base part of their trading decisions on moving averages. Common strategies include using moving average crossovers for confirmation or even buy and sell signals.
Another strategy may be to only go long if price is above the 200 SMA and short if it is below. These points can indicate that a stock is bullish or bearish.
Use a variety of time-frames to compare a stocks price over various periods. Create your own combinations of moving averages. Traders over the years have created infinite combinations of moving averages, and have utilized them to spot key breakout levels. Moving averages can be used in all time frames. A trader who is using multiple time frames and moving averages, gains a big advantage in ascertaining levels of support and resistance. This information can subsequently be used to time large breakouts.


