Trading Gaps
Post on: 25 Июнь, 2015 No Comment

A great email question from Mike:
I know you dont trade stocks but Ive always read that you leave gaps alone due to reversals. But take LOCM today; whats the buy point?
Im thinking $4.30 or is this to soon, or would $4.50 be the safer buy. I found it at $4.30 but stayed away because of the gap reversal, then watched it climb to $4.80. What are your thoughts on the whole gap play thing?
Mike
LOCM 5 min chart:
Email response:
Hi Mike,
Thanks for your email. Youre right. I dont trade stocks. But I just brought up a chart of LOCM what a beautiful trading session. Dont you just wish we could trade with the benefit of hindsight.
Ok gaps.
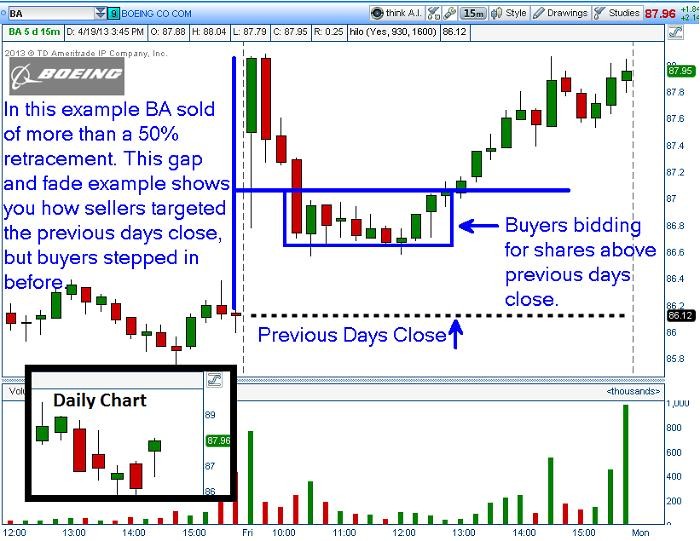
Ive mostly heard the same advice that statistically gaps will close more often than not, so we should aim to fade them. I tend to not like that advice. While it works well when the market complies with the rule, its downright dangerous on days like this when the market just gaps and runs.
Rather than fixed rules, I prefer to treat each opportunity in the market as a unique occurrence and trade it based upon what is actually occurring (rather than what statistics tells me should occur most often).
Look at the lower timeframe price action, or the tape, to find signs of strength and weakness. Whos winning the battle, the bulls or the bears?
Have a look at the following 1-min chart.
The initial two minutes showed bullish action, before selling came into the market to halt the rally. Note however that the selling was never able to completely overcome the bullish pressure, leading to an ascending triangle pushing against the highs of the initial rally. Strength is with the bulls at this time.
The first option (if you are comfortable taking breakouts) is to enter on a break of the $4.30 level. This might have got you in a little early, on the 9:37 candle which poked 2 cents above the level. If not, then 9:43 provided the money candle.
The second option is to wait for the pullback, and confirmation of weakness in the pullback. It complied nicely in this case for the first 4 candles, before then surging down to the $4.30 level which is a bit of a worry. Failure to break this level though is confirmation of continuing weakness. Entry is on continuation higher, which for me would have been the break of the high of the 9:51 candle (entry at $4.36, stop $4.27, watching the next swing high at $4.45 for signs of weakness requiring an early scratch, otherwise trailing a stop if it breaks that level).
Of course, its always easy in hindsight.
Cheers,
Lance Beggs
And back again:
Lance,
Thanks for the info.
One more for general practice, ZAGG on a 1 min chart entry would be around $6.45 on the 9:48 candle or if you wait for any type of pull back it would have been candle 9:56 at $6.60. Am I getting close to seeing this right?

Thanks a ton, Mike
Lets look at ZAGG:
Hi Mike,
Re ZAGG, I would have taken a short first, at $6.59 as it broke below the 9:35 candle. Two pushes higher had failed, with the second push not even reaching the highs of the first push (a micro-123 pattern if youre into patterns!!).
The break below the opening range clearly stalled though, indicating lack of support from the bears. This thing was still attracting buying pressure.
The reversal to long could be exactly where you suggested (around 6.45 on the 9:48 candle), if even better at 6.40 as price broke above the intermediate swing high.
For me, there was no sufficient pullback entry till around 10:10, offering an entry at $6.85. Its missed a fair bit of the move, but thats trading.
If you were able to get in on the 9:56 candle, well done. Id just be looking for more pullback than that. Theres no right or wrong way though just what makes money & what doesnt.
Cheers,
Lance Beggs


