Trading 101 Moving Averages
Post on: 4 Июль, 2015 No Comment

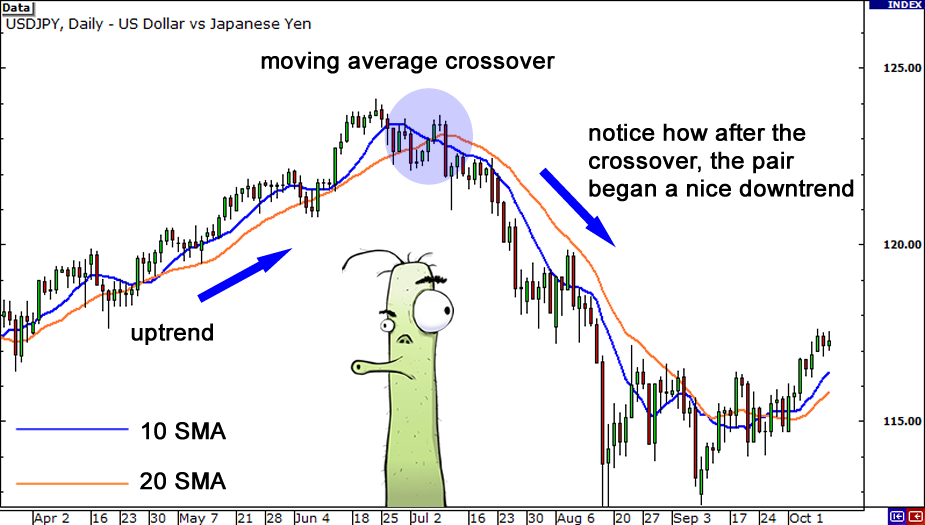
Moving averages (MAs) are very simple, yet extremely useful tools for investors. A moving average is simply the average of a series of numbers over a period of time which is constantly updated by dropping the oldest value and then adding the newest value and recalculating the average. So a 5-day moving average of stock prices would add up the closing prices for the last 5 days and then divide that total by 5. After the next trading day, we would drop the oldest day and calculate the average with the latest days price in its place. So over time the average moves as new data is added and old data is dropped. There are other, more complex, types of MAs (exponential, triangular, variable, and weighted are some of the more popular ones ) but for this discussion well focus on the type I just described, which are called simple (a.k.a. arithmetic) moving averages.
What MAs do is smooth out fluctuations in prices, thereby making it easier to spot trends. Weve all heard the expressions the trend is your friend and trade with the trend but often its difficult to identify the trend. Thats because stocks dont move in straight lines as well as the fact that the trend may be different depending on your time frame. For this discussion Ill define three different time frames as follows:
- Short Term A 10-day moving average. This is what short term traders would use.
- Intermediate Term A 50-day moving average. People with a few weeks to few months time frame might want to use this average.
- Long Term A 200-day moving average. Long term investors with a time frame of months to years.
Each of those groups could look at the same chart and see a different trend. MAs allow you to identify the trend by simply looking at the slope of the average. So if the line is slanting upward to the right the trend is up, and if its sloping downward to the right the trend is down. As an example lets look at a chart of the NASDAQ for the first half of this year (10-day is blue, 50-day is red, 200-day is green):
You can clearly see how the just using those three MAs there several trends in effect at any given time. So the key is to decide which trend(s) apply to your style of investing/trading. Some observations from that chart:
- Moving averages have a smoothing or dampening effect on the price chart. The longer the average the smoother.
- Moving averages are lagging indicators. Notice how the shorter averages hug the actual prices closely. But even the 10-day MA doesnt catch the exact turning points.
- A lot of money could have been made/saved by simply buying when prices crossed above the 10-day MA and selling when they broke below the average.
- In a strong uptrend the shorter term moving averages are above the longer term averages. See the left side of the chart. (The converse also holds true.)

How to Use Moving Averages
Here are just a few simple ideas for putting moving averages to work:
- Only consider buying a stock if it is above your moving average. By definition, if prices are below the average they are trending down. One of the best pieces of advice Ive read on this subject was from Trader Vic. He said
When picking stocks, I never buy a stock when prices are below the moving average, and I never (short ) sell a stock when price is above the moving average. Just pick up any chart book that uses a 35- or 40-week moving average and youll see why the odds of being right are way against you.
Mind you, this is after Vic does all of his fundamental analysis on a stock. So even if the stock looks great fundamentally, hell pass if its below the moving average.
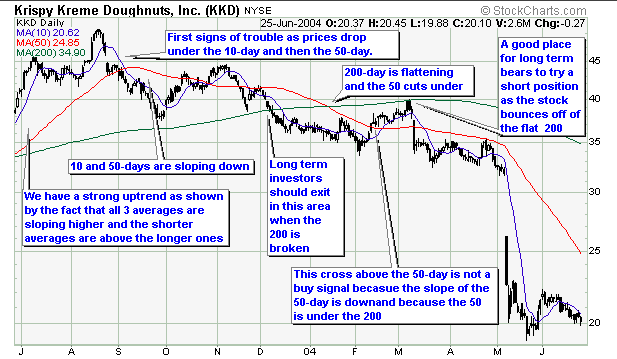
Lets look at some examples using some of the biggest winners and losers of this year. Heres Krispy Kreme Donuts which is down 59% from the August 2003 high and down 48% from when it broke under the 200-day MA.
QLogic, which is 53% off of its November high and down 44% from the day after it broke the 200-day MA. As you can see after breaking the 200-day MA there was no good reason to buy for any of our time frames.
Next we have Novatel Wireless which is up 320% this year. It just so happened to rise above its 50-day MA on the last day of December.
And finally, heres a chart of Taser which has had one of the strongest uptrends youll ever see. Its up about 4,500% since it rose above its 200-day moving average. You can see, based on how the 10-day moving average, that short term traders have been in control of this stock. It continually found support at that average.
As you can see moving averages are very simple to use and can help to protect your capital. Even using the late signal given by a break of the 200-day MA would have gotten you out of Enron and MCI long before they imploded. You can add moving averages to stock charts at just about any site that provides stock quotes & charts, like Ive done S&P 500 chart with moving averages here at Yahoo! Finance .
For more in-depth information about moving averages see the following resources:


