Top Inverse ETFs for 2015 (DDG EPV RUSS SH) (DDG EPV RUSS SH)
Post on: 14 Апрель, 2015 No Comment

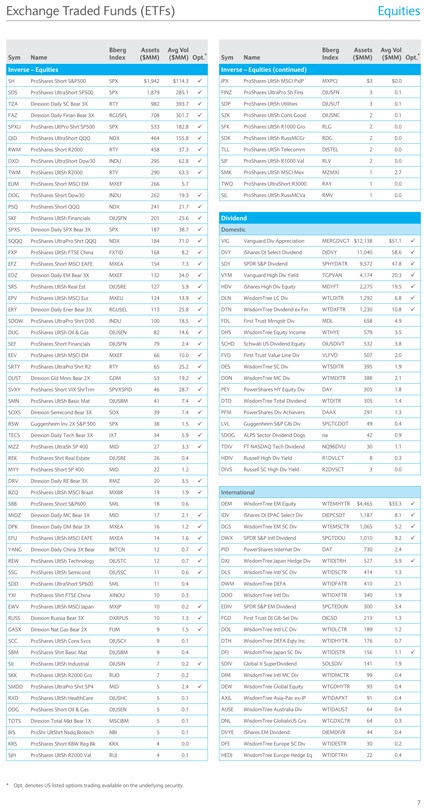
When volatility and uncertainty dominate the financial markets investors often find themselves tripping over each other on the race for the exit. However, with the rise in popularity of inverse ETFs this no longer needs to be the case. For those of you who are new to trading, inverse ETFs are designed so that the return over short-term investment horizons is inverse that of a key benchmark or group of stocks that the unit tracks. For example, the ProShares Short S&P 500 short ETF (SH ) targets a daily percentage return opposite the underlying S&P 500 index. If the S&P 500 falls by 1%, the inverse ETF should increase by 1%. Conversely, if the S&P 500 rises by 1%, the inverse ETF is expected to fall by 1%. (For more, see: Inverse ETFs Can Lift a Falling Portfolio .)
As shown in the example above, it is possible to use inverse ETFs to hedge movements in broad market indexes. However, sometimes investors only want to hedge a certain market event or segment of the market that may be negatively impacting their overall portfolio return. In the article below, we’ll take a look at several of the top inverse ETFs that are being used by traders in 2015. (For more, see: What happens if you don’t hedge your investments? )
Proshares Short Oil & Gas
It’s no secret that oil and gas prices have been under pressure for the last several months. While other segments of the market continue to trek higher it is natural for investors to look to hedge the moves in the oil and gas sector. One of the most popular ETFs for this job is the ProShares Short Oil & Gas ETF (DDG ). This fund corresponds with the inverse daily performance of the Dow Jones U.S. Oil & Gas Index. As you can see from the chart below, the fund is trading within a strong uptrend, which means that the oil & gas sector is trading within a defined downtrend. Traders will likely hold a bullish outlook on DDG until the price falls below the combined support of the ascending trendline and the nearby 50-day moving average ($26.28). Traders will also use the crossover between the 50-day and 200-day moving averages to suggest that the sector is in the early stages of a long-term downtrend. (For more, see: How Oil ETFs React to Falling Energy Prices .)
ProShares UltraShort MSCI Europe
With the recent news of massive quantitative easing in the Eurozone and the removal of the currency peg between the Swiss franc and the euro. many traders are looking to Europe for their next trading opportunity. Taking a look at the chart of the ProShares UltraShort MSCI Europe ETF (EPV ), which is to correspond with two times the inverse daily performance of the FTSE Developed Europe Index, you can see that it trading near a key levels of support. Traders will use the chart to suggest that the European indexes are getting ready to make another move lower. This sentiment will likely remain in place until the price closes below the 200-day moving average ($57.91). (For more, see: 5 Ways to Take Advantage of Europe’s Situation .)
Direxion Daily Russia 3x Shares
While traders will be watching the developments in Europe, another region of particular interest is Russia. 2014 turned out to be a trying year for the nation with news of vast government spending on the Sochi 2014 Winter Olympics, the Crimean Crisis and the impact of falling oil prices on the economy. As you can see from the chart of the Direxion Daily Russia 3x Shares (RUSS ), the spike in late December and retracement toward the long-term support level suggests that the story is not over yet. Traders will remain bearish on the Russian market until the price of RUSS closes below the support of the horizontal trendline, the 50-day and 200-day moving averages.


