Tiger Trading LongTerm Charts For ShortTerm Currency Trades
Post on: 5 Апрель, 2015 No Comment

Stock traders often add currencies to portfolios, in order to benefit from the incredible opportunities that currency trading can present. While it is true that stocks require a different set of analyses, there is enough in common between the two asset classes that should enable a stock trader to adapt quite easily to currency trading. Although the following method is designed as a swing trade that can be held for many days or weeks, it is also possible to use the tiger trading methodology to hold the position even longer, as long as the trade remains profitable. (To learn more about how currencies are traded Forex: Wading Into The Currency Market .)
Why the Tiger?
It seems that animal traits can be used quite effectively to describe human trader attributes. Let’s not forget that bulls can make money, and so can bears. but why the reference to the tiger? A tiger is a prodigious hunter and has the proverbial patience of a cat. It can sit and wait until the odds of a successful hunt are very high. For those traders with similar personality characteristics, trading the way a tiger hunts can be very lucrative.
What Is a Long-Term Chart?
In order to be a tiger trader, investors need to position themselves so that the trade opportunity can best be seen from a distance, so to speak. To get the overview of the market and the way it has been trading, we should always look to the weekly chart. For stock market traders, the weekly chart may be a relatively short-term chart compared with monthly (or even yearly) charts. However, in the forex markets, weekly charts are considered long-term, from a trader’s perspective.
What is Special About the Weekly Chart?
A weekly chart in the forex markets is the only time frame that shows a true close. The close is on Friday afternoon at 5pm EST, and the forex markets open again on Sunday at 5pm EST. Daily charts in the forex markets don’t really close, although there is a settlement time, which changes depending on which forex market you are trading in. For example, the New York market opens on Sunday at 5pm EST in New York. The following day, the New York closes at 5pm EST for settlement, and just one minute later, the market re-opens and all trading resumes. There is no overnight, because as soon as New York closes, Australia opens. Hence, forex markets trade 24 hours around the clock until Friday at 5pm EST.
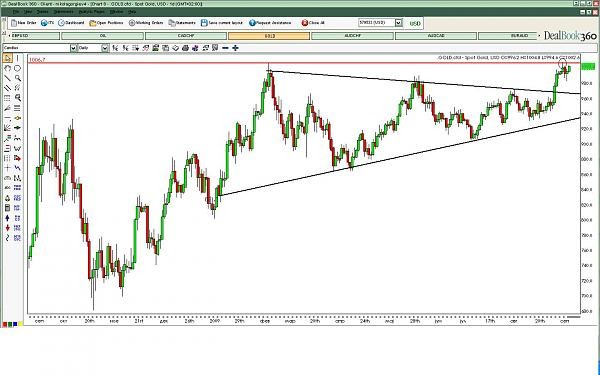
Using a weekly chart (Figure 1), we will be able to draw our lines in the sand, whether these are trendlines. Fibonacci lines. Gann lines, double tops or bottoms. etc. These lines are typically drawn from the weekly high or weekly low points, as well as on the weekly close. This will help to gauge where longer-term traders are focusing. Since the longer-term traders are usually the position traders who are usually interested in carry trade opportunities, they tend to take larger positions, and therefore, collectively are quite influential in creating a direction in the market.
Whether reversals often occur at Fibonacci levels are a result of some natural order that the market obeys, or whether the Fibonacci levels have credence because so many traders watch them, and therefore trade off of these levels, really doesn’t matter, as long as these levels display some validity.


