The Volatility Index Does Not Tell The Future
Post on: 16 Март, 2015 No Comment

Summary
- The VIX is shown to not convey the same amount of information when its value is low as when it is high.
- The current value of the VIX does not indicate anything other than the fact that the market is calm at the present time.
- An in-depth statistical analysis allows the predictive value of the VIX to be empirically tested.
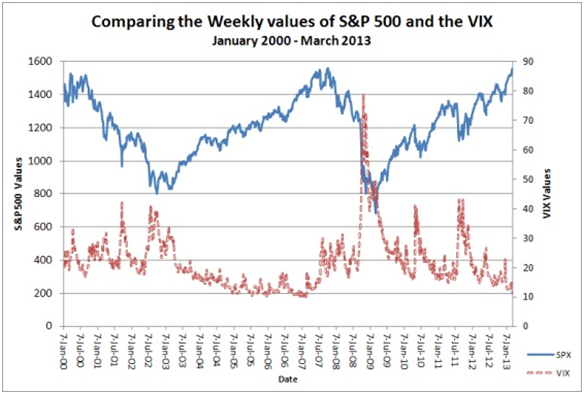
The VIX has been attracting a good deal of attention in the past few weeks; ironically, for the opposite reason that it usually makes headlines. When the VIX is reaching new multi-year highs, it is a good bet that the market is crashing. During the 2008 financial crisis, the VIX reached an all time high of 80.86 intraday. Looking at an overlay of the VIX on the S&P 500 makes it obvious why the VIX earned the nickname the fear index.
However, the question on everyone’s mind right now is what it means when the VIX is extremely low. Some have argued that the low reading is indicative of complacency among market participants. One technician claimed that the current chart pattern the VIX was making indicated a spike in the index was imminent. However, a more in depth statistical analysis shows that a low VIX value doesn’t say anything about the future.
Before going to the numbers, it’s worth reviewing exactly what the VIX is measuring. The VIX is calculated from the implied volatility on S&P 500 options. More importantly, the VIX is designed to measure the expected volatility over the next 30 days. There is a saying that bull markets take the stairs, bear markets take the elevator. In other words, prices usually change much faster in a bear market than in a bull market. That is just another way of saying bear markets are more volatile than bull markets. More volatility means it is riskier to sell options, leading to higher premiums. Higher premiums, mean higher implied volatility and higher implied volatility means a larger value for the VIX index. That is why the VIX is much more sensitive to declining prices and why high values of the VIX are associated with bear markets.

Now, demonstrating the significance of high VIX value as a signal for future market volatility is not straightforward. The details are beyond the scope of this article, but the results can be summarized as follows. A high VIX value is strongly correlated with continuing market declines and relatively high realized volatility. The same analysis does not say anything about low VIX values. The VIX can change rapidly, so a low value today does not correspond to any particular market action in the near future. In other words, it’s still just as possible for a moderate decline to suddenly push the VIX higher, so there is very little information carried by a low value.
This is easy to see by considering the daily logarithmic changes in the S&P 500 and the VIX. For my analysis, I used the closing values for both the VIX and S&P 500 and defined the log changes as the natural logarithm of the price on a given day divided by the price the day before. (I did all the following statistical analysis myself using historical data from Yahoo Finance.) The reason for logarithmic returns is that, unlike percentage changes, they are symmetric. So if the log return is -0.05 on a given day, then a log return of +0.05 the next day will leave the index with the same value it started. The graph of the log returns is very noisy.
Source: Data taken from Yahoo Finance. I made the graph using daily index data between 1/02/1990 and 6/23/2014.
In order to find the predictive value of changes in the VIX, I calculated the cross correlation. In this case, I used both the daily log return of the VIX index and the close of the VIX against the daily log return of the S&P 500 index. The result is shown below.
Source: Data by Yahoo Finance. I used the same date range as in the chart above.
The daily log return of the S&P 500 is the red graph at the top. The cross correlation chart shows the correlation between the value of the log return of the VIX (left) and of the VIX itself (right) at various points in time against the log return of the S&P 500 on a given day. So the lag -5 is correlating the value of the S&P 500’s log return on any given day with the value of the VIX 5 days before that day. It is easy to see that there is only one significant correlation in the chart. Specifically, it is saying that there is a correlation of -0.7103 between the log return of the S&P 500 on a given day and the log return of the VIX on the same day.
Given that the only meaningful correlation is when the lag is 0, there is no information about what is to come. If there were, the correlation would be stronger with a positive lag. It doesn’t fit well in this article, but I ran the analysis for over 200 days and lag 0 is the only significant correlation.
The takeaway is this, it is not possible to draw any conclusions about potential future volatility using only the fact that the VIX is low. Lower values of the VIX carry less information than very high values. All it tells you is that things are calm at the present time. This makes a great deal of sense, after all, option traders are just as human as the rest of us and cannot see the future. In the current environment, other indicators should be sought out.
Disclosure: The author has no positions in any stocks mentioned, and no plans to initiate any positions within the next 72 hours. The author wrote this article themselves, and it expresses their own opinions. The author is not receiving compensation for it (other than from Seeking Alpha). The author has no business relationship with any company whose stock is mentioned in this article.


