The VIX Indicator Investment U
Post on: 16 Март, 2015 No Comment

by Karim Rahemtulla Friday, September 10, 2010 Wisdom of Wealth
by Karim Rahemtulla. Investment U’s Options Expert
Thursday, September 10, 2010: Issue #1342
After you’ve read this article, the next time someone asks you, Hey, how’s the market looking? you’ll know what to say — and sound smart saying it!
Not only that, the information I’m about to share with you will also give you a valuable clue as to when to buy and sell your stocks.
In their columns this week, my colleagues, Alexander Green and Marc Lichtenfeld, talked about the importance of tuning out the media noise and constant flow of bad news. Instead, they advised that you pay attention to real indicators like earnings (which are good) and investor sentiment (which is bad).
And that doesn’t mean taking your cue from other investors and blindly following them. Quite the opposite, in fact. We continue to underline the importance of having contrarian instincts when it comes to investing.
But how can you tell what investors are feeling and the general mood of the market? Simple.
Using The VIX to Gauge Investor Behavior
The CBOE Volatility Index (^VIX ) is a measure of market sentiment, based on options trading among the S&P 500 companies.
In short, if more people are buying put options than call options, they’re betting that the market will head lower. As a result, the VIX will rise, indicating fear in the marketplace.
Conversely, if more investors are buying calls than puts, they’re predicting that the market will head higher and the VIX will fall amid perceived investor complacency.
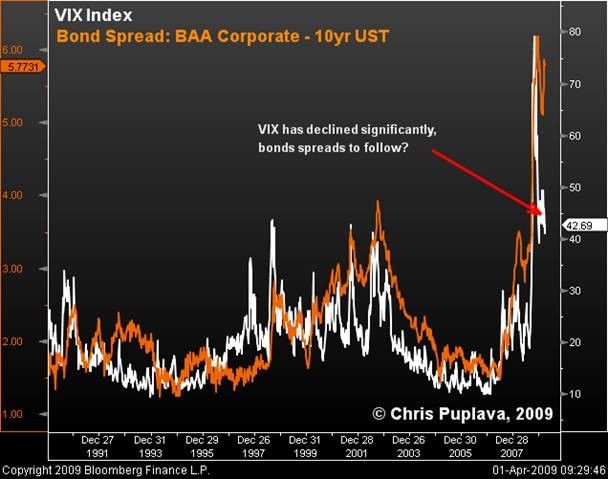
As you can see below, the VIX and market volatility were trending higher a few weeks ago. But you can also see that the rise in volatility wasn’t nearly as pronounced as it was in May after the infamous flash crash .
More recently, the VIX hasn’t confirmed the S&P 500’s move from the 1,100 level down to the 1,040 level. And as it stands now, the VIX is about 40% lower than it was when it spiked to 37.58 on July 1.
Translation?
Are You Watching the Head-and-Shoulders?
Basically, there’s an underlying bullish sentiment in the market. For evidence, the S&P 500 recently set what technical analysts call a head-and-shoulders pattern — a very bearish signal for the market. But the VIX didn’t confirm this pattern and, lo and behold, the market rallied again.
Head-and-Shoulders Pattern
As the name suggests, this is a chart pattern that bears resemblance to a person’s head and shoulders.
You can spot the pattern easily, as it will show two lower peaks (the shoulders) either side of a higher one (the head).
It’s marked by the price first rising to a peak before declining, thus setting the first shoulder. The price then rises again, above the first peak, which establishes the head. The price then falls again. The final step — i.e. the second shoulder is another rise in price to roughly the same level as the first shoulder.
Here’s what to watch for next.
Interpreting the VIX Indicator: When to Buy and Sell Your Stocks
Right now, VIX volatility is trending lower. This is important because if it continues in that direction — and into the mid to upper teens — you’ll want to buy the VIX. Why?
Because each time the VIX has traded in the mid teens, it’s represented a major opportunity to short the market, since that level has historically proved to be the bottom of the volatility range.
And that range — if we ignore only the most extreme bullish and bearish events as aberrations — is between 13 and 49.
Take the Market’s Pulse Every Day
Now do yourself a favor.
If you’re not tracking the VIX volatility index. do it. Just add the ticker symbol to your list. While there is no 100% accurate way of predicting what the market will do, it certainly pays to have indicators that can help you gauge investors’ moods and the market climate.
The VIX is my favorite way of doing so and it’s proved to be the most reliable indicator of the market’s future moves over a short period of time.
Good investing,
Karim Rahemtulla
P.S. There is an ETN that follows the VIX — the iPath S&P VIX Short-Term Futures (NYSE: VXX ). However, it doesn’t follow the VIX exactly and suffers from leakage — i.e. because of the costs associated with trading VIX futures, the fund leaks capital each month. Basically, it will give you about 60% of the VIX’s underlying moves. So if the VIX moves up 10 points, VXX will rise about six points.


