The VIX and What it Tells Investors About Market Volatility
Post on: 16 Март, 2015 No Comment

In light of recent market and macroeconomic turmoil, investors would be prudent to take a closer look at the various risks associated with their investment portfolios as well as the broader market. In general, greater economic uncertainty tends to become reflected in the market through increased volatility. Typically, as the range of potential outcomes for companies becomes wider, so, too, does the potential value of their stock prices. In periods of high volatility, stocks tend to exhibit wide price swings, whereas low volatility is usually characterized by less-dramatic movements in price.
One measure of volatility widely followed by investors is the Chicago Board Options Exchange Market Volatility Index, or the VIX (its ticker symbol). Commonly referred to as the “fear index” or “fear gauge”, the VIX was introduced by Robert Whaley, a then-professor at Duke University, in 1993. The index is formulated to measure the expectations for stock-market volatility over the next 30-day period.
The VIX is calculated using the implied volatility of a weighted range of S&P 500 Index options. For the mathematically inclined, implied volatility is the volatility of the price of the underlying security, based on a specific option pricing model, that is implied by the current market price of the option. It is quoted in percentage points and translates into the annualized expected movement in the S&P 500 Index over the next 30-day period.
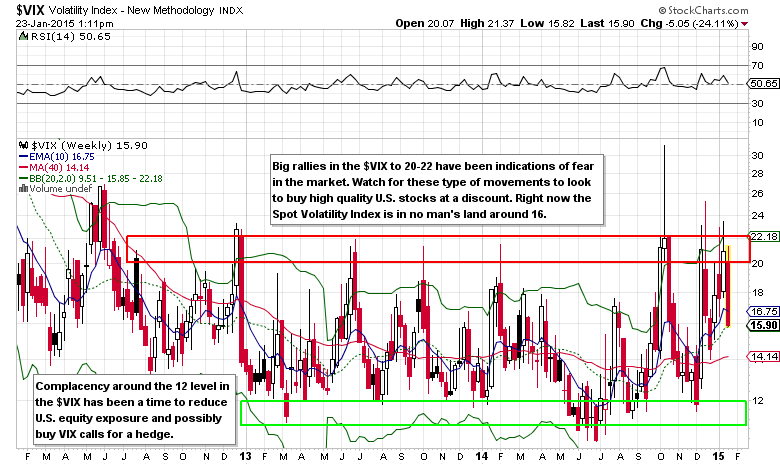
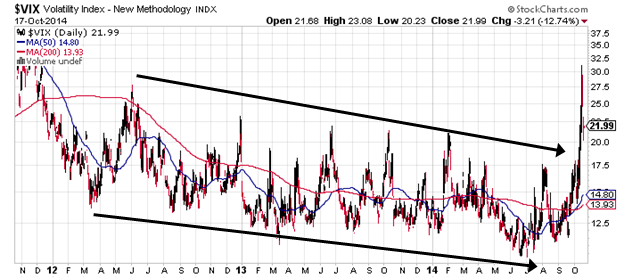
In general, a VIX reading of greater than 30 is associated with a large amount of volatility as a result of investor fear or uncertainty, and values below 20 typically correspond to more complacent times in the market. Many market technicians approach the VIX in conjunction with a number of other indicators in order to derive specific market tops, bottoms, and entry points. Indeed, the VIX has a negative correlation (albeit small) to the S&P 500 Index, meaning that they tend to move in opposite directions.

On a more macroscopic basis, however, the VIX can be used as a simple indicator of market sentiment. Prolonged high levels and especially large spikes in the fear index suggest increased uncertainty, and may be a good time for investors to take a more defensive approach to their portfolio, or put a hold on potential new investments. Alternatively, lower readings of the index may be met with a more-aggressive investment approach, or viewed as an attractive entry point.
Still, investors should exercise caution when using the VIX. As always, a holistic investment approach should be implemented, taking into consideration a given investment’s valuation, growth prospects, financial health, individual risk, as well as general macroeconomic conditions and so forth. Nonetheless, the VIX can serve as a useful indicator of general investor sentiment and, at the very least, should be a part of every investor’s vocabulary.
At the time of this article’s writing, the author did not have positions in any of the companies mentioned.


