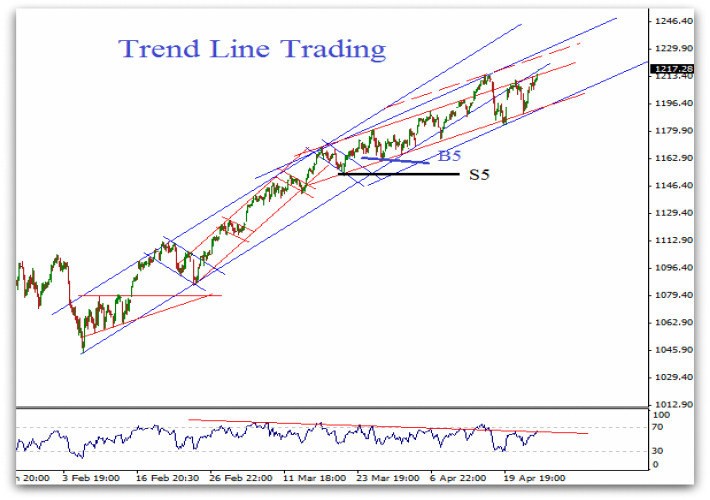
The Technical Analysis of Stock Trends for Beginners
Post on: 18 Август, 2015 No Comment

In my free newsletter I use technical analysis to analyze the stock market and when people first sign up to it they get a series of educational videos in which I teach them the basics of using charts, trading strategies, and technical analysis. If you aren’t already a member you can sign up by going here .
You may not know what technical analysis is.
If you have ever attended a business finance related class, logged on to a financial web site like Bloomberg, E*TRADE or Yahoo Finance, or just opened a Wall Street Journal, I am sure you have encountered a stock chart and the term: technical analysis. This article will give you a general idea about this investment method. You can learn a lot more in my fee stock picking guide and weekly update on the financial markets where I show you how to make money now with these ideas.
Technical analysis is a tool used to predict stock performance based on the past price history of a particular stock and its trading volume. Technical analysis was invented way back in the 18th century, Homma Munehisa, Japanese rice merchant. His technique eventually evolved in what is today known as “candlestick” price plotting in today’s market analysis.
The main focus of technical analysis is to identify pattern and trends in financial markets which traders use to predict future moves and make profit by trading large amounts of stocks.
The main tool to predict the performance is to study a price chart. Technical analysis utilizes methods based on price and volume transformations. Examples are: relative strength index, moving average and regressions. It should not be confused with fundamental analysis, which is a valuation method that considers actual company, its management, product, market condition, company’s financial condition, currency, government regulations and competitors.
Technical analysis is strictly mathematical and statistical valuation method. Only variables considered in technical analysis are: price and volume. This doesn’t mean, that fundamental and technical methods contradict each other or distort findings in any way, no; quite the opposite. These two methods should be viewed as complementary to each other. They are two different ways of achieving the same goal. Every respectable size brokerage firm has a team for each valuation method. Using fundamental and technical analysis will decrease errors and risks associated with stock market.
As every method used in the business, technical analysis has its supporters and critics. In 1960 and 1970 it was even dismissed by academics, but supporters of technical analysis were so convinced in their ideas, they have not given up and it still remains one of the most valuable tools for traders today.
Much research has been done on the validity of using past chart patterns to forecast the future, but no definite answer has ever been produced that everyone excepts.
Some have argued that, even though technical analysis does not predict accurate performance, it can be used to predict trends in the market. Their argument is that the method looks internally, rather than externally on the market. For example, markets have always gone up, down and even crushed.
Technicians argue that, by focusing on past performance of the stock, its volume and time span of trading, it can be used to make a reasonably accurate judgment on what is to come in the future.
Supporters of technical analysis argue that, history tend to repeat itself and people (traders) tend to behave the same way, they have a certain pattern of behavior when it comes to investing in stocks. Think about it, everyone is looking for a good stock to invest in; especially after 2008 financial crisis, when people saw their 401K decline by as much as 30%. People always are looking for a good buy. When DOW hit its lowest point of around 6500, Google stock was trading at $300.00. So called “opportunity traders” bought it and made a substantial profit. The most recent trade for Google stock was $588.65. This is the kind of pattern technical analysis uses to predict the future.
Recent studies showed some positive results. Historically we’ve found investing and tracking the 50 hottest stocks is the best way to make money. In another study out of 95, 56 trades were profitable. Some of the most respected traders and analysts use technical analysis and they are the biggest supporters of the method. Even a phrase was inspired by the technical analysis, “the trend is your friend”. The most recent success of the method was in Chinese markets, where substantial returns have been generated.
Globally, technical analysts are represented by IFTA (International Federation of Technical Analysts); in the US they are represented by MTA (Market Technicians Association) and AAPTA (American Association of Professional Technical Analysts). In UK it is represented by STA (society of Technical Analysts) and in Canada by CSTA (Canadian Society of Technical Analysts)
In conclusion, technical analysis is a method that strictly focuses on past performance of stocks to predict the future. Personally I’ve been using technical analysis for years to make money in the stock market. However, I also have combined it with fundamental factors to in order to create what I call the Two Fold Formula.
You can get this for free simply by signing up to my free stock trading newsletter below.


