The Inverted Yield Curve s Predictive Power
Post on: 19 Апрель, 2015 No Comment

I love the serendipity when two separate analyses show up saying the opposite thing. Such was the case this weekend, when I was looking at Art Laffer’s recent commentary on the Yield Curve. Then this morning, a WSJ front page (C1 of the Money & Investing section) had an article on the same subject. Let’s have a look at each, and see if there is anything to be derived from this tension:
Art Laffer created the Laffer Curve. and is known as the father of Supply Side Economics. He’s a genial guy whom I’ve debated a few times on Larry Kudlow’s show.
Our prime economic disagreement (aside from my agreeing with Greg Mankiw on Supply Side econ ) is that Laffer credits tax cuts for the expansion of this cycle. I, on the other hand, look at the 2001 and 2003 tax cuts as having some marginal impact, but not necessarily long lasting. I credit the ultra-low interest rates for the upswing in housing, hiring, and consumer spending. and its positive impact on the rest of the economy from 2002-2006. That impact has begun to unwound and is now turning negative.
Laffer believes the S&P 500 is undervalued by 67.2%, while I believe we are overdue for a correction of some significance. I guess we both believe the market is less efficient than many economists and academics assume.
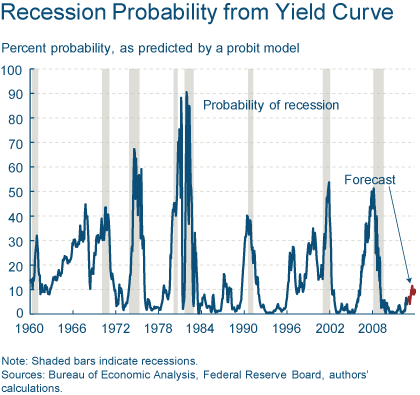
I have said that an inverted yield curve is a warning sign ; the longer and deeper the yield curve is inverted, the more meaningful a slowdown we are likely to get. Note that this is a probability analysis. Based on the yield curve alone, a recession is a 40-50% possibility. Other factors move that up to 60%.
Laffer disagrees:
In the past cases of the yield curve’s successful “predictions” of future recession, the stock market was either flat or dropped sharply. During the present yield curve inversion, the real S&P 500 index has increased some 11.3%. The stock market is most definitely not forecasting a recession.
• Past inversions were due to a credit crunch that drove up short term yields. We see no evidence of a credit crunch in today’s market.
• In the late 19th and early 20th centuries, inverted yield curves were typical. The upward-sloping yield curve has only been “normal” in the post-World War II era, when long-run inflation became the norm.
• TIPS yields point to continued prosperity.
There certainly is no credit crunch these days; as to the 19th century versus post WWII eras, I suspect the past 60 years is more relevant than the 1800s, which predates most of the world’s central banks now in existence.
And you’ve heard me say this many times prior: beware Economists relying on the stock market as proof of the economy.
Let’s go back to the issue of inverted yield curves: several other Bond market watchers have noted the issue. From this morning’s WSJ.
Yield inversions, many analysts say, are harbingers of hard times. When bond investors see a recession coming, they tend to buy long-term Treasury securities for two reasons. First, they are safer than stocks. Second, they are appealing when inflation is low, and recessions tend to beat down inflation. The buying that comes with recession fears drives down a long-term bond’s yield, sometimes below the prevailing yield on short-term Treasury securities.
One economic-forecasting tool using Treasury yield-curve data pegs the chances of a recession at nearly one in two. The model, which was developed by Fed economist Jonathan Wright, takes into account yields on 10-year and three-month Treasury securities as well as the Fed’s overnight funds rate.
Another forecasting model — developed by Federal Reserve Bank of New York economists using only the 10-year/three-month spread — puts the chances of a recession in 12 months at just under 40%.
What do the dismal scientists on the Street of Dreams think? The WSJ notes that Those predictions are at odds with the consensus among economic forecasters. A recent survey of economists by The Wall Street Journal pegged the chances of a recession within the next 12 months at 27%.
So is the Yield Curve still relevant? There is a dispute amongst economists to that effect. In addition to the aforementioned Mr. Laffer, several other notables have raised questions:
Two researchers who focus on recession forecasting, Lakshman Achuthan and Anirvan Banerji of the Economic Cycle Research Institute, argue that the yield curve is overrated as a recession harbinger. They note that the yield curve failed to invert before recessions in the 1950s and early 1960s. They also point to the misleading signal sent in 1966-67, when a lengthy inversion didn’t precede a recession.
We know that there were recessions that were not preceded by an inverted yield curve. But were there inverted yield curves that didn’t produce a recession?
Those who think highly of the yield curve’s predictive power have history on their side. Seven times between 1965 and 2005, yields on the 10-year note have dropped below those on the three-month Treasury bill for an extended span. In six of those instances, the U.S. economy went into recession soon after.
For example, the 2001 recession was predated by a yield-curve inversion that lasted from July 2000 to January 2001. In the one time when a recession didn’t follow, in the mid-1960s, there was still a sharp slowdown in growth.
That is a rather significant track record that suggests inverted yield curves ought to be closely watched for other confirming signs. And I am watching the following very closely: Transports, Retail sales, Durable Goods, Manufacturing, Housing Foreclosures, Auto sales, Business Capex. These are significant sectors of the US economy — and all of these indicators are flashing a danger sign.
One other warning factor worth watching: Laffer ends his piece by claiming This time is different! History teaches us that those are the four most expensive words in the English language.


