The Great Depression
Post on: 20 Май, 2015 No Comment

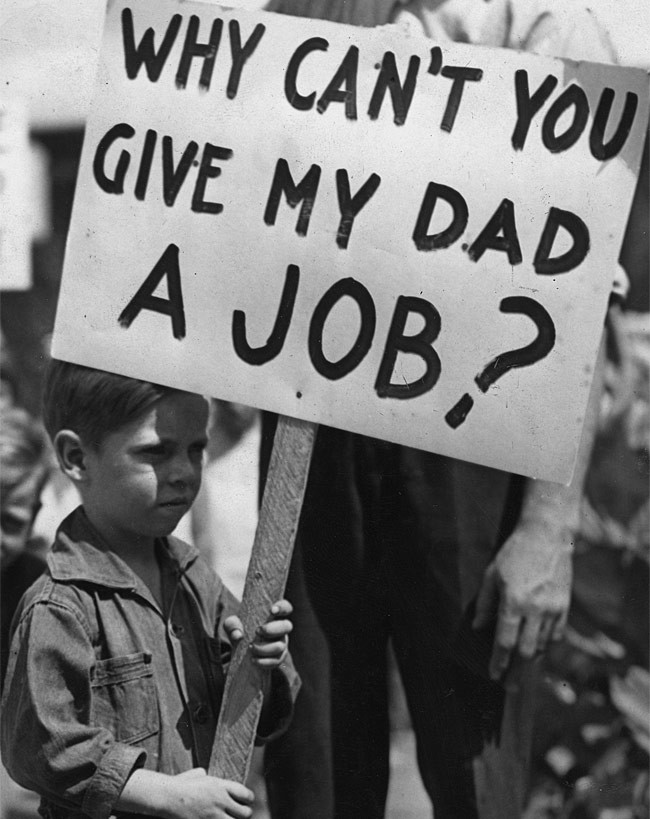
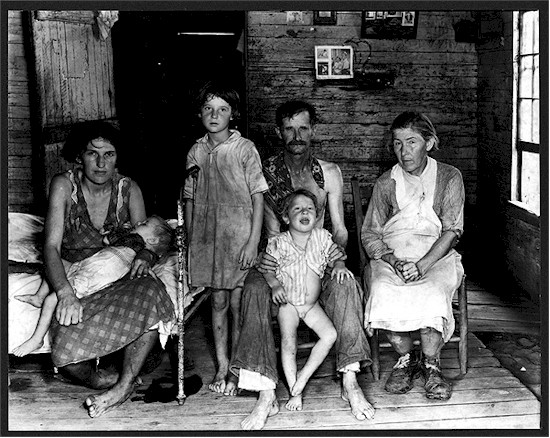
The decade of the 1930s saw the Great Depression in the United States and many other countries. During this decade large numbers of people lived in poverty, desperately in need of more food, clothing, and shelter. Yet the resources that could produce that food, clothing, and shelter were sitting idle, producing nothing.
At the worst point of the Great Depression, in 1933, one in four Americans who wanted to work was unable to find a job. Further, it was not until 1941, when World War II was underway, that the official unemployment rate finally fell below 10%. This massive wave of unemployment hit before a food stamp program and unemployment insurance existed. There were few government programs designed to help the poor or those in temporary difficulty. Further, most wives did not work, so if the husband lost his job, all income for that household stopped. An equivalent rate of unemployment today would cause less economic hardship because of the variety of programs (often inspired by the Great Depression) that cushion unemployment and poverty.
Many people date the beginning of the Depression at October 24, 1929, Black Thursday, the day the stock market crashed. This was indeed a traumatic day for those who owned stock as sales volume broke all records. But the decline in overall stock prices was only about 2.5%, from 261.97 to 255.39 as measured by the New York Times index of 50 stocks. Most of the decline still laid in the future; the market hit bottom on July 7 of 1932 when the Times index was only 33.98, a decline of over 89% from its high of 311.90 of September 19, 1929.
However, economists date the Depression somewhat differently. First, they usually make a distinction between recession and depression, and they use the concept of recession much more than they use the concept of depression. A recession is a period in which economic activity is receding or falling, while a depression is a period in which it is depressed below some level. In the picture below, which shows a path of economic activity through time, the period from a to b is the period of recession. At time a the economic activity is peaking, and there is a trough at time b. After b the economy is in a recovery or expansion stage. (Some economists call the period from b to c the recovery and the period after c the expansion phase.) Which period is best called a depression is less clear since one must first decide which level provides the measure of normalcy. One could consider the period from a to c the depression because after c the economy is above its previous high point, but there are other options that make as much sense.
The period that is called the Great Depression contained two periods of recession. The first began in August of 1929 (two months before the stock market crash) and ended in March of 1933. (These dates have been chosen by the National Bureau of Economic Research, a nonprofit organization that sponsors a great deal of economic research. They are based on the analysis of a large number of economic time series, and do contain some subjective elements.) In the first recession the value of goods and services that the economy produced fell by about 42% (but only by 36% once the effects of price changes are eliminated). The recovery in the four years that followed was slow and not completed by the time the second recession began. In this recession lasting 13 months from May 1937 until June 1938, output fell by 9% (but only 6% when the effects of changes of prices are eliminated). 1
The three graphs here show the effects of these two recessions on output (Gross National Product or GNP), unemployment, and prices. Note that prices fell considerably from 1929 to 1933, but not afterwards despite the very large levels of unemployed resources. As a result of this fall, those who kept their jobs and received the same pay in 1933 as in 1929 were much better off in 1933 than they were in 1929. Another group that should have benefited from the decline in prices was creditors because the real value of what was owed to them increased as prices fell. However, many debtors could not pay because of the poor business conditions, so not all creditors actually benefited from the deflation.

People perceive the 1930s as a period in which business failures were very high, and they were when one compares them to what happened in the 1940s and 1950s. During the years 1930 to 1933, the annual failure rate was 127 for every 10,000 businesses. In contrast, failure rates in the 1950s were between 40 and 50, and for the 1940s they averaged only 23. However, during the years 1925 to 1929, a period usually considered prosperous, the failure rate averaged 104.
There was one segment of business that was unusually hard hit during the Depression, the banking industry. The table below shows the number of banks each year and the number of bank suspensions. A bank suspension indicates that the bank closed during the year, but it does not mean that the bank failed. Some banks closed only temporarily. Nonetheless, the total number of banks fell by about one third during five years, either through merger, failure, or voluntary liquidation. This process was not invisible to the public. The most dramatic banking crisis in the history of the United States took place in early 1933. In one of his first acts as president, Franklin Roosevelt declared a banking holiday and, as a result, no banks were open from Monday, March 6 to Monday, March 13. The drastic reduction in bank suspensions in 1934 reflects both new policies and the enactment of legislation to insure banks.


