The Cheapest And Most Expensive S&P 500 Stocks Utilizing CAPE And PEG Ratios
Post on: 11 Июнь, 2015 No Comment

Summary
- Utilizing the CAPE Ratio for individual stock selection within a portfolio has been shown to have some historical merit.
- Here, we have updated the S&P 500 list of stocks with their respective CAPE Ratios, and provide the 10 cheapest and 10 most expensive stocks as ranked by the CAPE.
- At the request of others, we have provided the CAPE alongside the PEG ratio as a means of identifying growth in earnings as a possible reason for a high CAPE.
- We have also provided a novel metric alongside the PEG, which we will call the CAPEG or Cyclically Adjusted P/E to Growth.
Using the CAPE Ratio to select stocks for a portfolio has been shown in the past to have some reasonable merit and some level of success. I have discussed here before. how one can double the S&P 500’s return through using a portfolio of low CAPE stocks, and variations utilizing a similar approach have been backtested before by Wesley Grey and Jack Vogel in their research, which you can find right here .
In this vein, we have provided the cheapest stocks as valued by CAPE for the S&P 500, as well as the most expensive in the past. As Josh Brown from thereformedbroker.com has hinted out, however, it would be beneficial to list these stocks with respect to growth rate. It is probably not fair to simply consider a stock as overvalued, because a modified P/E ratio indicates that the price-to-earnings is overvalued.
To be more equitable, here is a list of the cheapest and most expensive stocks on the S&P 500 shown alongside their PEG ratios. I have also integrated the usual PEG of one year with the Cyclically Adjusted P/E over Growth rate for a rather novel metric which we will call CAPEG. Naturally, I have done this where I could; negative earnings/growth preclude the use of these metrics in the case of certain stocks.

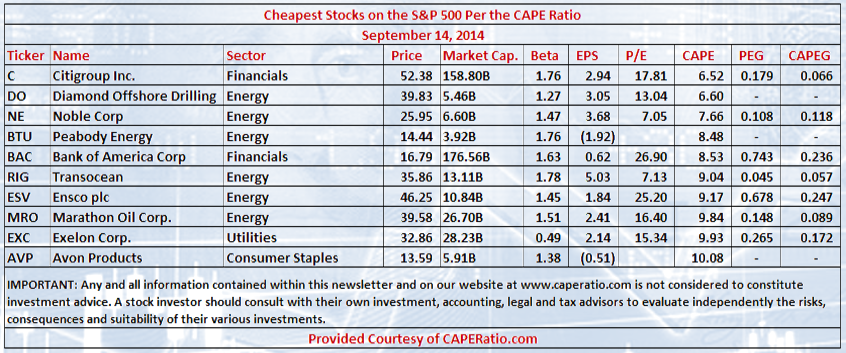
Here are the cheapest stocks as ranked by CAPE, alongside their PEG Ratios:
Here are the most expensive stocks as ranked by CAPE, alongside their PEG Ratios:
As one can tell from the lists presented here (especially the list of the most expensive CAPE stocks on the S&P 500), the PEG is helpful for understanding why some of these stocks might be considered overvalued per CAPE, while some of them still might represent a good buy despite the fact that their CAPE and P/E is rather high.
Netflix (NASDAQ:NFLX ) would seem to be a good example of a stock with a low PEG and a high CAPE. We could postulate that the current price is therefore mostly representative of the rapid growth that the company is currently experiencing. Therefore, the price reflects an expectation of even higher future earnings that would be in proportion to how earnings have accelerated during the past 12 months. So even if CAPE seems to show this stock as overvalued (and the more traditional P/E does as well), we can still assume that the stock provides strong value, in contrast to a company such as Amazon (NASDAQ:AMZN ), which is not priced at all with respect to either current earnings or the recent growth rate of those earnings.
The lower 10 CAPE have PEG ratios that are generally significantly lower than the most expensive group. The average of the cheapest 10 stocks have an average PEG of roughly 0.31, while the highest 10 CAPE have a PEG ratio average of roughly 2.1. It would seem that this shows that the high CAPE cannot be altogether explained through higher growth rates. Naturally, this might be unwarranted speculation, but assuming that the PEG of the overvalued group should be about 1.0, and if the stocks were priced to reflect growth, then the CAPE overall would be roughly half of what it currently is for the more expensive group of stocks.
On a somewhat unrelated item, the beta for the low CAPE stocks is also significantly higher, broadly speaking, than the beta of the more expensive group of stocks. Therefore, invest in this group with caution.
Conclusion:
It would seem that for several of the stocks included in a most expensive listing of S&P 500 stocks as identified by CAPE, there are a few where the expensive status is warranted with respect to recent growth and as measured through earnings. However, overall, the group would still be considered expensive in the context of the cheap group’s respective growth rate. We can conclude, therefore, that the value of identifying these stocks through CAPE is somewhat mitigated at times by a correspondingly high growth in recent earnings, but at times, the growth-related metrics are really showing us even more reasons why a value investor might consider avoiding the companies.
The data used here is current through Friday’s closing price. For a complete list of the S&P 500 as ranked by CAPE, you can go right here .
Disclosure: The author has no positions in any stocks mentioned, and no plans to initiate any positions within the next 72 hours. (More. ) The author wrote this article themselves, and it expresses their own opinions. The author is not receiving compensation for it (other than from Seeking Alpha). The author has no business relationship with any company whose stock is mentioned in this article.


