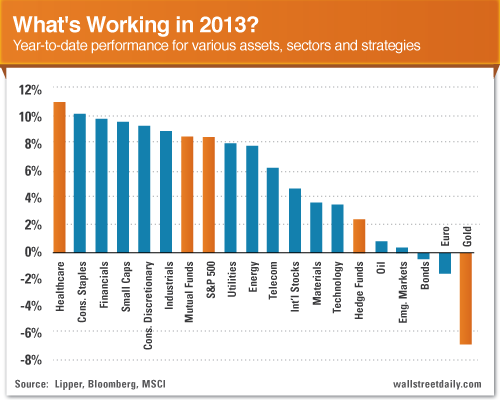
The Best (and Worst) Sectors to Invest in 2013
Post on: 17 Сентябрь, 2015 No Comment

Share | Subscribe
In his book How to Make Money in Stocks, famed investor and founder of the Investor’s Business Daily publication William J. O’Neill suggested that the performance of the sector and industry in which a stock is categorized ultimately determines one-third of an individual stock’s performance. In other words, just by picking the right industry (or avoiding the wrong one), an investor is well on the road to solid profits. Since that statement, some studies have shown that a particular sector’s influence can approach 50% of a stock’s overall movement. Either way, the lesson is clear — sectors matter.
With this in mind, some clear sector trends have emerged in the past four quarters that investors should consider as we head into the new year. I broke out these trends according to market capitalization. allowing investors to better pinpoint hot and cold spots.
Let’s take a closer look at them.
Large caps
Although the broadmarket was a bit of a disappointment in the third quarter, with the S&P 500 posting a 3.7% decline in year-over-year operating profits, there were a couple of bright spots within the large-cap group. Consumer discretionary stocks, for instance, solidly grew their third-quarter income, reversing modest weakness seen in the second quarter, and putting up growth numbers that other sectors didn’t even come close to reporting. Take the financial sector as an example. The sector posted a 4.7% decline in year-over-year income, while energy stocks saw income fall 28% in the same period.
Industrials such as  Raytheon Co. ( RTN ) and L-3 Communications ( LL ) deserve an honorable mention, too. While last quarter’s near 6% improvement in year-over-year income isn’t huge, these companies have been quite reliable on theearnings front and are priced fairly. L-3, for instance, saw 12% year-over-year income growth in the most recent quarter, and is only priced at 9.1 times its trailing 12-month profits.
It’s not all bargain-basement pricing and red-hot growth for large caps though.Consumer staples stocks are priced at the extreme upper end of what the market may view as palatable right now, with an average price-to-earnings (P/E ) ratio of 15.9.
Basic materials stocks posted pitiful numbers in the third quarter. Had it been the first time we’d seen weakness from the sector, it might be dismissible, but the group has been in trouble for four consecutive quarters. While the sector’s forward-looking P/E ratio of 11.9 seems to already reflect pessimism regarding the future, deteriorating earnings continue to be red flags. Gold-mining stocks are hitting a wall, but other miners are also falling short.  Titanium Metals ( TIE ). for instance, posted a 38%profit decline in the third-quarter compared with the same period last year. E. I. du Pont de Nemours and Co. ( DD )  missed estimates by 30.6% last quarter and has actually seen profits decline by nearly 10% in the past 12 months.
Mid caps
As well as large-cap consumer discretionary stocks have done of late, the mid-cap stocks in the sector have been even stronger. The average year-over-year earnings growth from the mid-cap stocks in this group for the past four quarters is a whopping 31%, making their slightly-elevated valuations more than worth the price, with an average trailing P/E ratio of 17 for the group.
Running a close second are the industrial stocks. In fact, mid-cap industrial stocks have been better performers than their large-cap counterparts in the past four quarters, averaging a 23.3% increase in year-over-year income. They’re still bargain-priced too, trading at about 12.4 times their projected 2013 earnings.
On the flipside, telecoms among the mid-cap group have been an earnings disaster and are way overpriced to boot. Mid-cap energy stocks have also hit a wall, though at least these stocks are now priced down to appropriate levels, trading at 12.8 times their projected 2013 earnings.
Small caps
Considering the sector was one of the best for the mid-cap and large-gap groupings, it should come as no real surprise that small-cap discretionary stocks are among the top performers relative to theirmarket cap peers. The financials and consumer staples stocks top the list of strong growers as well. Still, investors may want to choose individual stocks carefully for all three groups, since valuations have become frothy (even by small-cap standards).
Laggards from the small-cap realm include technology and energy. Both sectors have seen their small-cap stocks repeatedly post double-digit declines in year-over-year profits for several quarter’s now.
The only other red flag from the small-cap group is health care. Though these companies have been reliable earners, the average 9.5% growth pace doesn’t quite merit a trailing P/E ratio approaching 20. The forward-looking P/E of 16.3 isn’t exactly compelling either.
Risks to consider: Although these are long-term trends, it doesn’t take a full year for a tide to turn. Anything can happen in less than a quarter. Investors should always be cognizant of the fact that even the biggest of trends can change, sometimes quite abruptly.
Action to Take —> The next logical step for investors looking to apply this analysis is simply to consider paring current holdings they may own in the troubled sectors. Also, it’s not that this rotation of stocks has to happen immediately. After all, it took four quarters for these trends to become evident. This analysis should simply be the groundwork for an allocation plan heading into 2013.


