TechniTrader® MetaStock Tools and Charting Custom Indicators from TechniTrader
Post on: 21 Июль, 2015 No Comment

*For MetaStock® Advanced Tools Version 11 Click Here
TechniTrader® 2014 Advanced Tools for MetaStock® Version 13
The Advanced Tools include scans, chart templates, indicators, software tools and more for the Advanced Metastock® students.
31 Proprietary Custom Scans designed specifically for MetaStock® Users
17 TechniCator™ Chart Indicator Templates designed for MetaStock® Charting Software
Custom Hybrid Leading Indicators written for MetaStock® Charting Software and available exclusively from TechniTrader®
TechniTrader® Custom Proprietary Conditional Ranking System for stronger stock selection
TechniTrader® and MetaStock® Charting Software Tools instructions
Software tools and more for the Advanced Metastock® students.
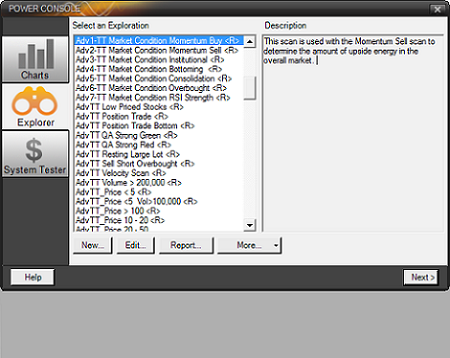
TechniTrader® Market Condition Scans
Market Condition Analysis is the proprietary method developed by Martha Stokes, CMT for analyzing the overall conditions of price, volume, market participant group activities, price patterns, buying, selling, momentum, overbought or oversold patterns, etc. for all of the stocks traded on the exchanges at that time. The TechniTrader® Market Condition Scans far exceed the standard market breadth, advance and decline, new highs and new lows types of market indicators. The Market Condition Scans are easy to use and provide a fast, reliable method for determining market direction and strength as well as the day-to-day bias and energy for short term trading.
This is a highly accurate method for determining when, how, and what to trade. The accuracy of these custom scans is over 95% in indicating the direction, strength, energy, and bias for the next trading day. Market Condition Analysis is exclusively available from TechniTrader® and taught exclusively by Martha Stokes, CMT, the developer of this unique, easy-to-use market analysis tool.
Market Condition Momentum Buy Exploration:
Analyzes the momentum energy of the buy side of the market for all of the stocks listed on the exchanges. When this scan rises in number, then the market has strong momentum buying activity. High Momentum Buy Scan numbers with high Institutional Scan numbers indicate a velocity or moderately trending market condition.
Market Condition Momentum Sell Exploration:
Analyzes the momentum energy of the sell side of the market for all of the stocks listed on the exchanges. When this scan rises, then the market has strong momentum selling activity. High Momentum Sell Side Scan numbers with LOW Institutional scan numbers indicate a sell side momentum market, moderately trending down or a velocity market down trend. Comparison of the momentum explorations indicate what direction the market will take, whether there is sufficient activity for swing and momentum trading, or if the market lacks sufficient activity that would create whipsaw action.
Market Condition Institutional Exploration:

Analyzes large lot activity. When institutional investors are buying quietly, accumulating stock without moving price, this scan picks up their activity. This is important because often the markets look flat or insipid before a huge move up or down. This is a buy side exploration. When the numbers are too low, this is a sign of a risk of sell-down action. High numbers in this scan with low momentum scan numbers indicate the market is consolidating, bottoming, and preparing for sudden momentum energy.
Market Condition RSI Strength Exploration:
Shows when high numbers of stocks are moving sideways in either consolidations or platforms. These sideways patterns are useful for position and swing trading.When the market is sideways with rising RSI strength, this is an indication of a platform market condition. High RSI scan numbers along with high Institutional Scan numbers indicate a bottoming market on either the short term or intermediate term trend with imminent momentum potential.
Market Condition Consolidating Exploration:
Analyzes how many stocks are in consolidations, stairstep patterns, and other tight sideways patterns. This exploration helps determine moderately trending, platforming, and other sideways market conditions. When the number of charts rises in this scan, the market is building quiet energy that is often not seen in the indexes and market breadth indicators.
Market Condition Bottoming Exploration:
Exposes how many stocks are in bottoming formations on the short and intermediate term trends. This is vital information for traders to quickly identify when a market is starting to form a bottom after a correction on the short term and intermediate term trends. As this exploration rises in numbers, a short term or intermediate term correction is ending.
Market Condition Overbought Exploration:
Contrarian scan that tracks stocks in wide sideways and trading range patterns as well as stocks starting to develop topping patterns. When the overbought scan rises in numbers, it often warns of a top on the short, intermediate or long term trend. This is a sell side scan designed to expose overextended upside patterns before stocks and the overall market turns. This scan works ideally in topping and trading range market conditions as the number of charts rise.
Advanced Trading Style Scans and Price Analysis Explorations:
Trading Style explorations are designed for specific trading styles. These are the scans students will use to find stock picks quickly. These can be adapted to price range and candlestick patterns to suit the individual student’s needs. Price Analysis explorations are used for analysis of the overall market based on price and for specific price range trading strategies.
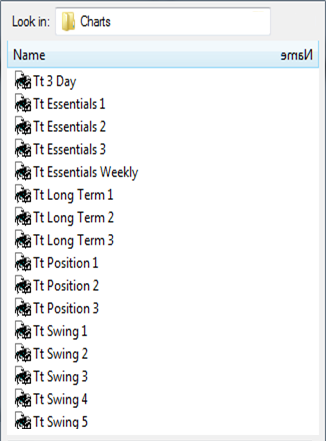
TechniTrader® Chart Templates with Custom Combination Indicators:
Chart templates in the Advanced Tools for MetaStock are set up with the proper candlestick charts, the pre-set time frame, indicators on the price chart when applicable for the chart template, 2 combination indicators below the price chart, and the correct period settings for the indicators. Indicators are set up for the appropriate formulas and settings for specific trading styles. TechniTrader® Chart Templates are designed to make analysis of stock picks fast and reliable, eliminating extra work and streamlining the analysis process.
* Scan numbers vary between markets. Records should be kept to reveal strong and weak ranges. © 2014 Decisions Unlimited, Inc.


