Technical analysisTrading StrategiesDow Theory moreArticle 32
Post on: 12 Апрель, 2015 No Comment

Dow Theory
The Dow Theory is a theory dealing with the technical analysis of stock and is perhaps one of the first theorys dealing with technical analysis. It was created by Charles H. Dow in the early 1900s who theorized on how the stock market behaved and how the market can be used to measure the health of businesses in general. While his theory focused mainly on price, it differs a bit from mainstream technical analysis because the theory is concerned with movements of the broad markets rather than with specific securities.
Charles Dow believed that all information including past, present and future is reflected in the price of stocks and indexes. The Dow Theory also suggests that the market discounts everything. As a result investors only need to focus on the stock price movements itself rather than on the reasons for the price movement. Again, this falls in line with the basic principles of stock technical analysis as opposed to fundamental analysis.
These factors that affect pricing however include many things such as inflation, interest rates, state of the economy, politics, as well as investor sentiment and emotion. (See the psychology of investing) Many long term traders study these intrinsic factors, through fundamental analysis, while technical analysts believe that these factors are already expressed in the price movements. Basically the Dow Theory suggests that all factors are priced into the market, those that could happen, those that have happened, and those that are expected to happen. The stock market then adjusts, along with the prices, to reflect the new information.
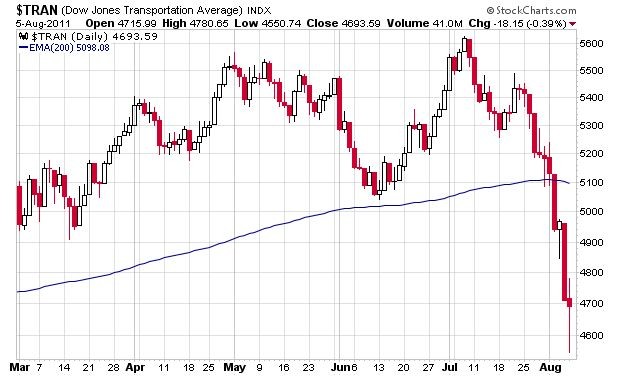
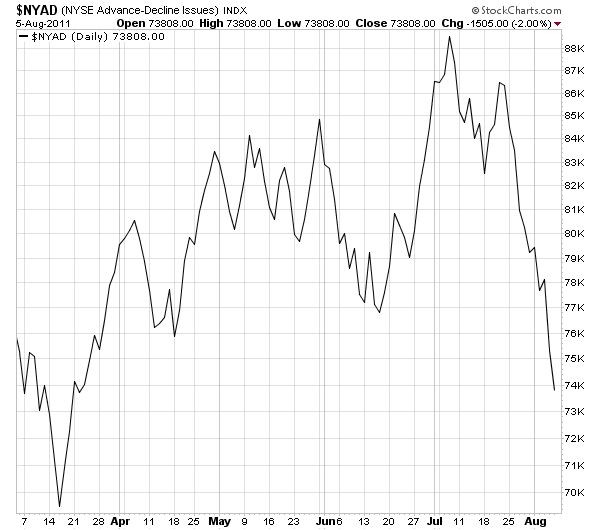
Under the Dow Theory a major reversal from a bear to a bull market cannot be signaled unless both indexes both show it occurring. That means is one index is in a bullish market while the other is in a bearish market there is no clear trend. If both indexes however are both in uptrends or downtrends, then the trend is confirmed.

The Dow Theory also suggests that when stock market is doing well it is because conditions are good overall. Conversely, when the market is doing poorly, then it is due to poor business conditions. Again, as stated above, if the two market indexes are conflicting, then there is no clear trend in the general condition of businesses.
Continue to research more about stock market technical analysis. There are many other theories and tools available to investors who are interested particularly in short term stock trading. Explore the basics as well as the technical indicators that signal things which are occurring in the markets.
Market Direction. Candlestick analysis is extremely good for analyzing the market trends in general. The question is often asked which market index is best to use for analyzing the market trend. The Dow is often criticized for having too few stocks to represent the overall market. The NASDAQ or the S&P 500 are more representative of the markets in general because of the larger number of stocks represented. When applying candlestick analysis, time is not lost when analyzing all three indexes. Due to the simplicity of the visual analysis, making an assessment of the market trend can be done relatively easy in less than one minute total each afternoon.


