Technical Analysis The Best Technical Indicators
Post on: 16 Март, 2015 No Comment

Related Topics
Technical Analysis Library
Advanced Strategies
When To Sell Stocks
Technical Analysis Definition
The study of price and volume to determine the future price of a stock. Technical indicators derive calculations based on stock trading volume and price. These indicators, or combination thereof are then used to make a Technical Analysis of a particular stock, without regard to the underlying fundamental factors such as earnings and revenue.
The Secret lies in the combination of indicators to use: Its the secret sauce to success. The right combination of technical analysis indicators will increase your chances of catching the largest trends that lead to big profits.
The Best Way To Learn Technical Analysis: Nothing beats real world experience. To make money in the markets you have to pay attention. Financial markets are dynamic and changing every day. Make money trading stocks by staying informed. Watch how technical analysis is applied in the Stock Market Today video.
The Best Technical Indicators
Click on Each Topic To Learn In Depth
Price Action - This is the foundation of ALL technical indicators. It can be found on a stock chart. Its best to study price action through the given technical analysis indicators below, however understanding pure price action does have its advantages and does not lag like most indicators. Read More
Stock Volume - How many share are traded in a given moment can tell you when a stock may breakout. Its plotted below the main upper chart. Volume can identify critical entry prices, and a signal when to sell. Volume spikes can identify the beginning of a market crash, and the birth of a new bull market.Read More
Support and Resistance - These lines define critical price levels. This is the point of where you can make a stock trade with minimal risk, and maximum profit. Understanding where the important price levels are gives you the ability to know when to execute a trade. Read More
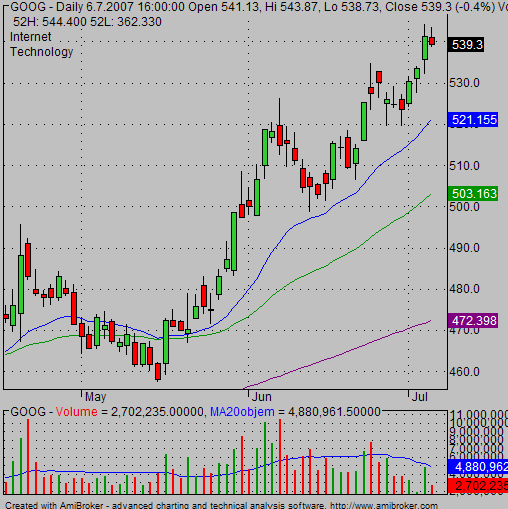
Candlestick Chart Is a type of stock chart, that is popular among stock traders who study technical analysis. It is effective in spotting bullish and bearish price action. It can also spot the beginning and ending of stock trends. Read More
Trendline These lines connect price points to identify upward, downwards, and sideways markets. This simple technical analysis line can help you decide what type of trading system to use, help to understand market direction, and define points of entry and exits. Read More
Moving Average These lines smooth out the volatility in price action. A combination of time frames help to identify the trajectory of a given security of stock, index, or market as a whole. Applied to certain stock, it can also serve to provide sell signals. Read More
Average True Range (ATR) This technical indicator is an analysis of price volatility over time. The derived figures help to determine how much stock to buy. It also provides price points in which to buy more during and upward trend. The placement of stop loss and exit points serve to minimize risk and keep a trader in the game during losing streaks. Read More
Volatility Stop Similar to ATR, it function is to show volatility. This indicator is a favorite alternative to ATR because it is plotted on the upper price chart so you can see the actual entry and exit points. Read More
Chart Patterns There is a tendency for stocks to first make a pattern before making a major move. By spotting patterns like triangles, Cup and Handles, and Double Bottoms you can determine when the best time to buy stocks. Read More


