Technical Analysis and How it is Used to Predict Stock Prices
Post on: 13 Июль, 2015 No Comment

Technical analysis uses a variety of charts and calculations to spot trends in the market and individual stocks and to try to predict what will happen next. Technical analysts dont bother looking at any of the qualitative data about a company (for example, its management team or the industry that it is in); instead, they believe that they can accurately predict the future price of a stock by looking at its historical prices and other trading variables. Technical analysis assumes that market psychology influences trading in a way that lets them predict when a stock will rise or fall. For that reason, many technical analysts are also market timers, who believe that technical analysis can be applied just as easily to the market as a whole as to an individual stock .
Critics of technical analysis, and there are many, say that the whole endeavor is a waste of time and effort. They point to academic studies like Burton Malkiels A Random Walk Down Wall Street as evidence that there is no possible way to predict future prices using historical prices. Others contend that if any such systems were found to be successful, those who practiced them would be wealthy beyond their wildest dreams, and yet there arent any billionaire technical analysts (yet).
Technical analysts use dozens of different quantitative metrics in order to predict stock prices. In this section, well introduce you to some of the most popular ones and explain to you what theyre all about, but first here are a few key terms you should know about:
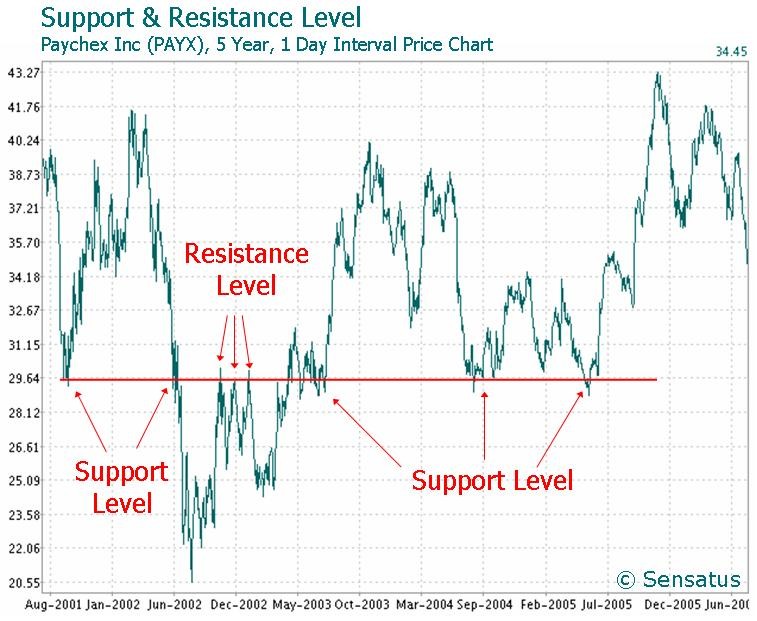
- Support Level: The level that the technical analyst believes a stock price will not fall below (also sometimes called a floor)
- Resistance Level: The opposite of a support level, the level that the technical analyst believes a stock price will not exceed.
- Breakout: If a stock surpasses the resistance level or falls below the support level, it is said to be a breakout.
- Advance-Decline Line: The total number of advancing issues minus the total number of declining issues, added to a cumulative total.
Moving Averages
Perhaps the most commonly used variable in technical analysis, the moving average for a stock is the average selling price for the stock over a set period of time (the most common being 20, 30, 50, 100 and 200 days). Moving average data is used to create charts that show whether or not a stocks price is trending up or down. They can be used to track daily, weekly, or monthly patterns. Each new days (or weeks or months) numbers are added to the average and the oldest numbers are dropped; thus, the average moves over time. In general, the shorter the time frame used, the more volatile the prices will appear, so, for example, 20 day moving average lines tend to move up and down more than 200 days moving average lines.

Relative Strength
Technical analysts use what is called relative strength in order to compare the price performance of one stock to the entire market. The relative strength of a stock is calculated by taking the percentage price change of a stock over a set period of time and ranking it on a scale of 1 to 100 against all other stocks on the market. For example, a stock with a relative strength of 90 has experienced a greater increase in its price over the last year than the price increases experienced by 90% of all other stocks on the market. Some technical analysts like stocks with high relative strength rankings, believing that stocks which have recently gone up are more likely to continue going up. Other technical analysts believe that a very high relative strength can be an indication that the stock is overbought and is ready to fall. Relative strength is really a rear view window metric, measuring only how the stock has done in the past, not how it will do in the future.
Momentum
Momentum investors seek to take advantage of upward or downward trends in stock prices or earnings. They believe that these stocks will continue to head in the same direction because of the momentum that is already behind them. The idea relies on the belief that there are a large number of lemmings in the market who will buy whatever stock is already hot. Momentum investors do not necessarily believe that momentum stocks will do well in the long run, but they do think that in the short run people will continue to buy them as they have in the immediate past. This therefore involves a lot of market timing which of course entails a substantial amount of risk. Both moving averages and relative strength can be used in order to determine momentum.
Charts
Charts are the main tool that technical analysts use in order to plot their data and predict prices. Technical analysts may use several different types of charts in order to conduct their tests, including line charts, bar charts, and candlestick charts. Most of the time, analysts use these charts in order to look for patterns in the data. Some of the more commonly used patterns include:
- Cup and Handle: A pattern on a bar chart that is in the shape of the letter U over a period of between 7 and 65 weeks. Once the stock price reaches the second peak of the U, technical analysts believe that the price will fall as investors who bought at the previous peak start to unload their shares.
- Head and Shoulders: A chart formation in which a price exhibits three successive rallies, the second one being the highest. The name derives from the fact that on a chart the first and third rallies look like shoulders and the second looks like a head. Some technical analysts consider it a sign that the stock will fall further.
- Double Bottom: A chart formation that looks like a W. Technical analysts aim to buy at one of the troughs and ride the stock higher.
Bollinger Bands
Bollinger bands on a chart have three lines in them: an upper band, a lower band, and a band at the moving average. The upper and lower bands are placed precisely at two standard deviations above the moving average and two standard deviations below the moving average respectively (standard deviation is a mathematical measure of volatility). Bollinger bands will expand and contract as the market for the stock becomes more or less volatile. If the stock price reaches the upper band, then the stock is thought to be overbought; if it reaches the lower band, then it is thought to be oversold.
Volume
Not all technical analysts focus exclusively on price. Many of them think that volume is often times a better indication of where a stock is heading. Volume is simply the number of shares of a stock that are traded over a particular period of time (e.g. 1 day or 30 days). Some technical analysts calculate moving averages for volume, the same way others do for price. Volume is important because it tells how active the stock was during a particular time, which can in turn affect a stocks price. For example, if a stock falls precipitously but volume was exceptionally light that day, this is not necessarily an indication that the stock has fallen out of favor with the market, since the move was caused by a relatively small number of sellers.


