Technical Analysis
Post on: 3 Август, 2015 No Comment

Stock analysis consists of Fundamental analysis and Technical analysis.
If you are like me not listening to tips and trade advices, you should make your own analysis.
(I started my stock trading career by buying shares recommended by my savvy friends and brokers. One of my broker had recommended to sell a particular stock to my friend and advised me to buy the same share. He just exchanged the shares between us and pocketed commission from both of us. Those were the days when electronic trading was not yet started and physical shares were being traded.)
What is Technical Analysis?
In the book Technical Analysis of Stock Trends, written by Robert D. Edwards, John Magee, W.H.C. Bassetti it is defined that It is the science of recording, usually in graphic form, the actual history of trading (price changes, volume of transactions, etc.) in a certain stock or in ‘the Averages’ and then deducing from that pictured history the probable future trend.
It is security analysis based on technical data or stock’s market data which is generated by the action of the market under study, like price and volume, and open interest in case of futures and options.
The principles of analyzing stocks technically are derived from the observation of financial markets over hundreds of years. The oldest known example of such analysis was a method developed by Homma Munehisa during early 18th century which evolved into the use of candlestick techniques, and is one of the main charting tools used today.
Dow Theory derived from 255 Wall Street Journal editorials written by Charles H. Dow inspired the use and development of modern technical analysis from the end of the 19th century. Other pioneers of such analysis include Ralph Nelson Elliott and William Delbert Gann who developed their respective techniques in the early 20th century.
What is the rationale behind Technical Analysis?
Analyzing stocks technically is based on three premises:
- Market action discounts everything
- Prices Moves in trends
- History tends to repeat itself

Market action discounts everything
Technical analysts believes that it is redundant to do fundamental analysis and ignores all the fundamental information of the companies. They hold that prices discounts all fundamental data before investors are aware of them.
Some traders use technical or fundamental analysis exclusively. While others especially big funds and smart money use both types of analysis to make trading decisions.
Prices Moves in trends
Prices always moves in trends. Similar to Newton’s first law of motion, a trend in motion will continue in the same direction until it reverses.
So once a trend is established, we can take trades in the direction of the trend and stay in the trend until we get sign’s of reversal.
History tends to repeat itself
An irrational emotion exists in the market, which moves the stock prices. Human mind tends to repeat the same reactions in every set of actions.
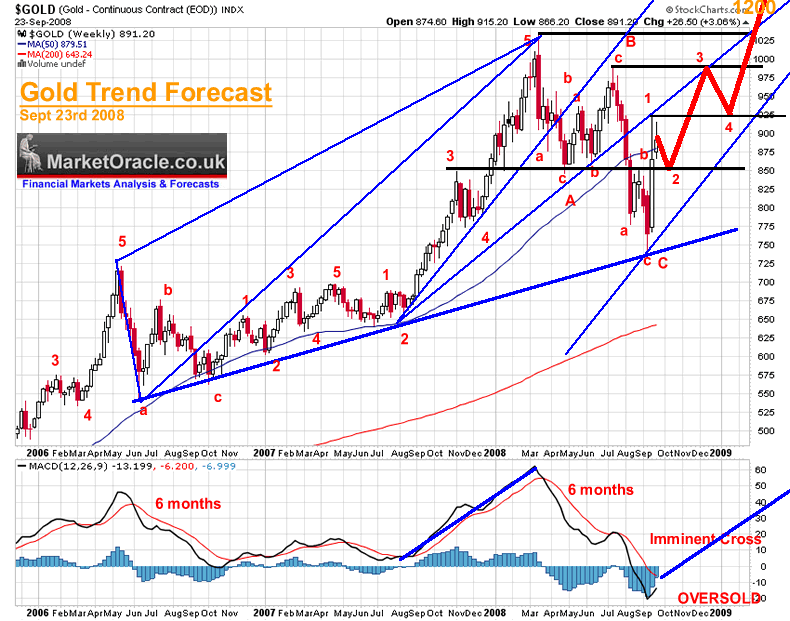
Technical analysts primarily use stock (price) charts and indicators. which are typically mathematical derivatives of price or volume. They believe that investors tend to collectively repeat the past behavior which forms recognizable patterns on the chart.
They seek to identify these trends and chart patterns in financial markets and attempt to exploit them.
It is always a pleasant surprise for me, that so often the conclusion of analysis of stocks technically holds on in the future.
Click here to go from Technical Analysis to Fundamental Analysis.


