Support and Resistance_2
Post on: 16 Март, 2015 No Comment

Support and Resistance
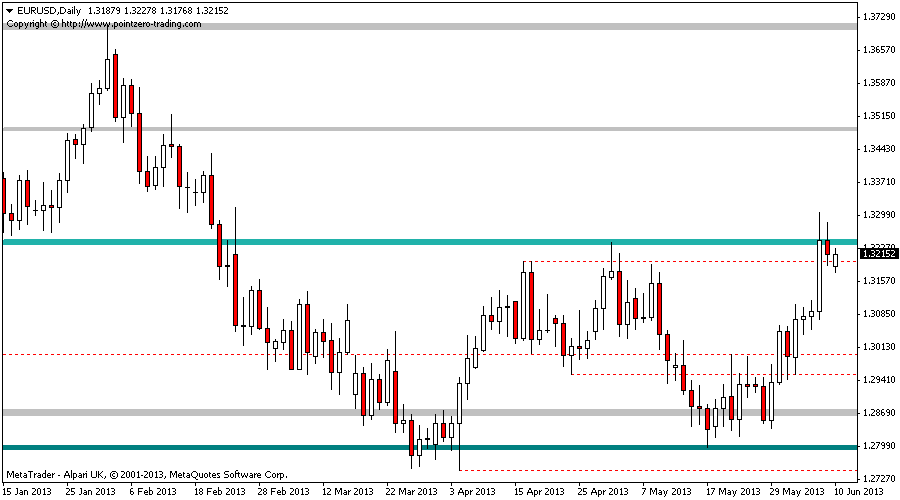
Support levels indicate the price where the majority of investors believe that prices will move higher, while resistance levels indicate the price at which a majority of investors feel prices will move lower. Prices often tend to bounce off of these levels rather than break through them. However, once price has broken through a support or resistance level it is likely to continue moving in that direction until it encounters the next support or resistance level.
An interesting phenomenon of support and resistance levels is that once a support level has been broken it often becomes a new resistance level and, alternatively, when a resistance level is broken it often becomes a new support level.
Another point of interest is that the more often a support or resistance level is tested (that is touched and bounced off of by price), the more significance that particular support or resistance level gains.
Interpretation
Support and resistance levels can be calculated using several different methods: trend lines, Fibonacci ratios, pivot point calculations are just a few. VT Trader uses a different method to construct this Support and Resistance indicator. Resistance levels are calculated by finding the highest high value over the previous n-periods at each occurrence of the price crossing below an n-periods simple moving average of price. Support levels are calculated by finding the lowest low value over the previous n-periods at each occurrence of the price crossing above an n-periods simple moving average of price.
There are two basic techniques for using the support and resistance levels to generate trading signals.
Price Breakouts: When trading price breakouts, a buy signal occurs when the price breaks up through a resistance level. A sell signal occurs when price breaks down through a support level. When a previous resistance level is broken it has the potential to become a new support level and vice versa. When a previous support level is broken it has the potential to become a new resistance level.
Price Reversals: When trading price reversals, a buy signal occurs when the price moves towards a support level, gets very close to it, touches it, or moves only slightly through it, and then reverses and moves back in the opposite direction. A sell signal occurs when the price moves towards a resistance level, gets very close to it, touches it, or moves only slightly through it, and then reverses and moves back in the opposite direction.
The materials presented on this website are solely for informational purposes and are not intended as investment or trading advice. Suggested reading materials are created by outside parties and do not necessarily reflect the opinions or representations of Capital Market Services LLC. Please refer to our risk disclosure page for more information.


