Stockwinners Chart Reading Basics – profitable trading investment trading
Post on: 16 Март, 2015 No Comment

Chart Reading
Please read the important disclaimer at the bottom of this page.
We have received many questions from our readers asking, How does one go about learning chart reading? This page addresses some of the significant basics.
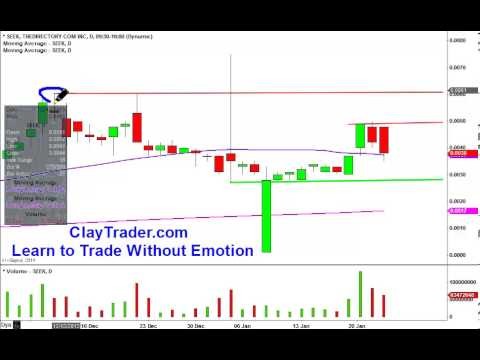
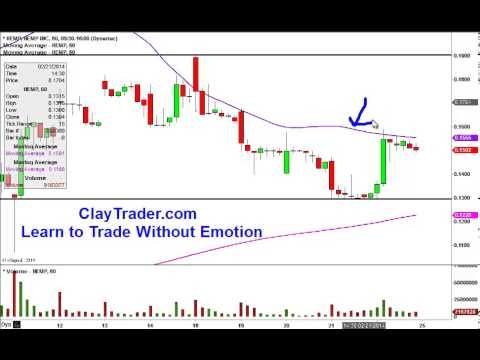
What is a Chart? Simply put, a chart is plot of price fluctuations of an equity versus time. The chart is a complete one when volume is also plotted. Charts provide a record of the interplay of supply and demand for a given stock. They provide a history at-a-glance of trading in a stock, showing how many shares were traded, at what price they were traded, when they were traded, and so forth. It is very important to remember that the time period represented by a chart is one of the most critical things affecting what that chart can tell you.
What is Chart Reading? The purpose of chart reading or chart analysis is to gauge probable strength of demand versus pressure of supply for a stock, at various price levels. This allows one to predict the direction in which a stock may move and where it may stop.

The clues are provided by the history of a stock’s price movements recorded on a chart. In the market, history often repeats itself. Chart price fluctuations tend, with some consistency, to fall into a number of patterns. Each pattern signifies a relationship between buying and selling pressures. Some patterns, or formations, indicate that demand is greater than supply. Others suggest that supply is greater than demand. Still others imply that the two are likely to remain in balance for some time.
Let’s be clear about one thing before going any further. There is no infallible systems for predicting stock prices. There are educated guesses!
A cursory glance at a few stock charts will reveal that prices have a tendency to move in a particular direction for a considerable time. A closer examination will show that this tendency, or trend, frequently assumes a definite pattern, zig-zagging along an imaginary straight line. In fact, this ability of prices to stay close to a straight line is one of the more extraordinary characteristics of chart movements. There is nothing mystical about chart reading. Stocks trace various patterns for reasons soundly based in human psychology. Remember, it is psychology that determines stock movements. The tendency for stocks to to move along a straight line, for example, is not hard to explain. In physical terms, it often is likened to the law of inertia (Newton’s Third Law). That law states that an object in motion will continue in motion in the same direction, until it meets an opposing force. In human terms, an investor will tend to resist paying more for a stock than the price other people have recently been paying for it, unless it continues moving up, which will give him some confidence or hope that it will keep going up. Conversely, an investor will resist selling a stock for less than the price other people have been getting for theirs, unless the price keeps declining and he fears it will continue to decline.


