Stocks big price increase surge volume change reversals breakouts
Post on: 21 Май, 2015 No Comment

Stocks with sudden price increases (surges) & stocks with sudden volume increases (surges), stocks starting new trends, breakouts through overhead resistance, selling climaxes, reversal patterns, and watch list candidates.
For information on pre-surge setups and the scans available for them, go to Pre-Surge Setups .
Also, see Focus on Setups to Reduce Risk .
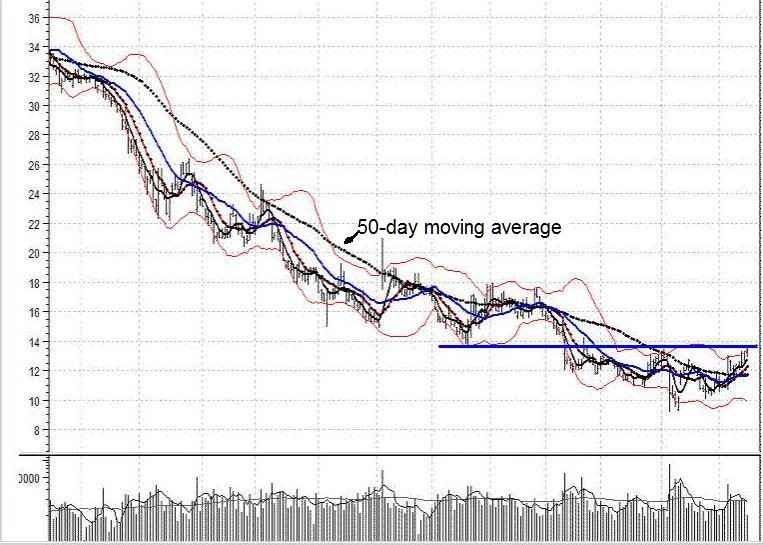
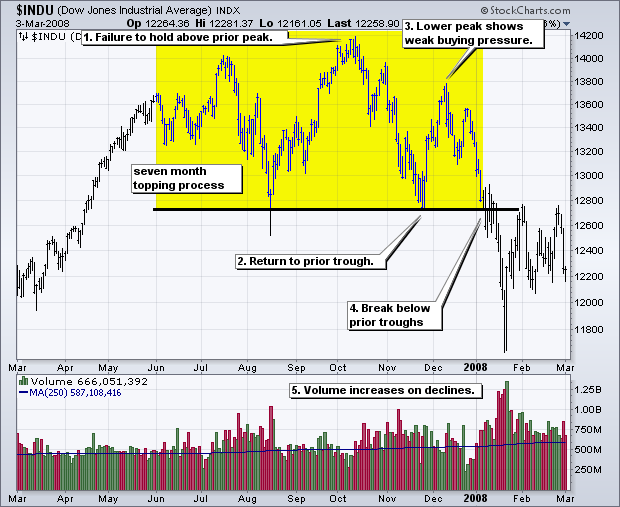
Here, we look for stocks with a price and a simultaneous volume surge. Why monitor price-volume surges? Consider the following. When traders believe their indicators suggest a stock is about to break through a line of resistance some will act in anticipation of the event (buying pressure will increase). Other traders will buy when they notice. even before the breakout, the increase in volume on price increases and diminishing volume on price declines. When a stock actually breaks to the upside through resistance, other traders will notice and buy, causing the price and volume to surge. These conditions often precede the beginning of a significant price move. It is only logical that if a company has just developed an exciting new cure, product, or service, people will hear about it and act accordingly. The price of its stock will surge and its trading volume will increase (the stock price will pick up momentum).
High-powered professional traders have systems that flash an alert or signal when a stock has an unusual price and volume surge. When they note it, they will buy and the price/volume surge will be magnified. Whenever a stock starts a new trend, it draws attention. Traders like to buy at the beginning of a trend. Therefore, when the price spikes up and the volume surges, momentum for the new trend builds. When a stock has been declining and the last holdouts give up, their selling will cause the stock to decline even more as the volume surges. Traders will notice the stock’s behavior and buy the bargain. Volume will increase even more as the price reverses direction. In this scenario, the stock has just had a selling climax and a price reversal. More traders will then notice that the stock’s chart shows there has been a selling climax and begin to accumulate. Others add the stock to their watch list so they can buy as soon as the new trend takes on more definition.
Often, the surges highlighted on an alert list will not be particularly attractive to a trader because the stock’s pattern will be compromised by nearby overhead resistance. However, the alerts sometimes present an opportunity to get in at the beginning of a nice move. A stock’s closing price relative to the day’s price action and overall price pattern, and its volume at the close (and the percentage change in volume for the day) are important when the stock has had a price surge, gap or spike. These lists are presented so that you can evaluate the situation for yourself.
Subscribers get a list of up to 90 stocks that have had both a volume and a price surge at the same time. The free list provided below is taken from the bottom portion of the subscriber list.
Individual Stock Alerts (Price Surges)

The free lists of surging stocks provided here focus on 1-day surges and are found by scanning a database of more than 8000 stocks. These stocks have all experienced some unusual action. A daily review of the charts of stocks listed here can enable you to observe setup configurations evolving, and maybe also enable you to uncover stocks that have recently started out on new trends, stocks breaking out of a consolidation pattern, or stocks that have had unusual market activity for some other reason. We suggest reviewing the charts of these stocks to see if they are of sufficient interest to warrant purchase or inclusion on your watch list. One reason for including a stock on your watch list is so you can monitor it while waiting for a good entry point. For example, you might wait for a pullback to a rising trendline. You might also wait for some sign that the trendline is holding or that the stock is responding to it in a positive way. Waiting for such a pullback can also help you optimize your stop-loss placement. The buy price is then only slightly above support. Therefore, when the stop loss is placed a little below the expected support (the trendline), any decline that triggers the stop will be a meaningful decline because support could not stop the decline, but the decline that triggers the sell order will also be relatively small (and so will any loss if the unexpected happens).
The free list posted below consists of 10 or more stocks that have surged in price by at least 2%. They have also had a simultaneous volume surge of at least 50%. For example, if there are more than 100 stocks that have surged in price 2% or more and that also have had a volume surge of 70% or more, then we provide subscribers with a list of the top 90 stocks in order of price surge magnitude. The bottom 10 stocks on that list are provided below. Remember that, in general, the greater the price and volume surge, the higher the probability of a subsequent move. Therefore, the stocks most likely to have a significant move tend to be higher on the subscriber list. Even so, stocks included in the top 90 that have had both a volume and a price surge and taken from a database of over 8,000 stocks, should be worth investigating. The minimum volume surge percent used in our screening is reported at the top of the table so you can do your own screening. If the subscriber list is short on a given day, there may not be any stocks listed below. There would be none listed here, for example, if subscribers get a list of 70 stocks.
A price increase of 1% combined with a 50% volume decrease may not be particularly noteworthy (but it could be). However, a price increase of 2% combined with a 50% increase in volume will definitely generate some interest. The numbers reported are percent changes for price and volume respectively. For example, a reading of 23 in the Vol % Ch column would mean that volume surged 23%. Short-sellers will be interested in stocks with large negative surges on heavy volume. The column headings are closing price, % change in price, 1-day percent change in volume (Vol % Ch), and 12-day momentum (12d Mom).
Want to know about the timeliness of these scans? Click on New or Old?
Stocks Surging in Price and Volume


