Stock Upside Trade Indicators Trailing stops Profit Stop limits
Post on: 10 Июль, 2015 No Comment

Topics
Target 2
- Target 2 is a price which may be reached on an extreme stock rally which occurs only 5% of the time or approximately 1-2 times every 6 months.
- A stock rarely remains at Target 2, some investors may want to sell at Target 2 to lock in good short term profits.
Upside Trade Tips
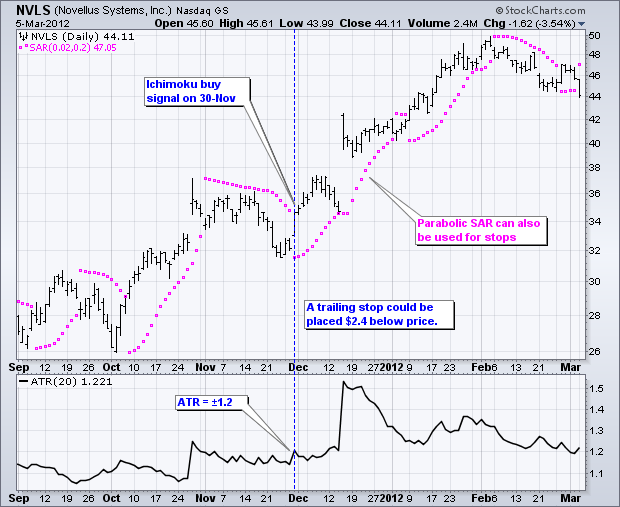
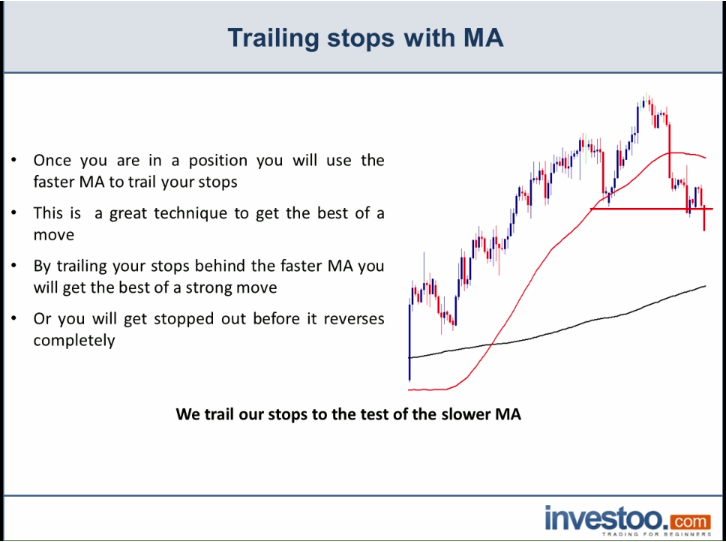
- Trailing stop limit can be used as a tool to lock in profit when adjusted daily to be below the stock price as it moves higher. This removes the decision on When do I sell? while maximizing short term profit.
- The stock’s Target 1 potential drops significantly when strong double or triple resistance areas exist midway between the current price and Target 1.
- The Targets 1 and 2 may be exceeded on very strong rallies that occur over a short time frame. Stocks that are slowly up trending the Target’s 1 and 2 will track higher with the trend.
- Upon going long at the start of a rally the stop limits are typically left loose. then as the rally progresses the trailing stop is tightened. If the stock reaches Target 2(extreme rally and/or extremely overbought) one should set a very tight stop limit to lock in short term profit.
- Beware of temporary gaps down in price in the morning from triggering your stop and stealing your shares.
- Stop limits should be tightened after 3 days of flat stock price movement.

If a stock has a good rally but then is flat for 3 days then one should be able to tighten the stop. If after 3 days no attempt has been made to move higher then a resistance area will have formed and the stock may be in danger of pulling back at that time. At this point two possibilities exist: it will move higher and you will profit from a future rally or you will lock in good profits on any weakness. This also can be applied to buying stocks on a pullback to support. If after 3 days no strength is seen then the stock may be in danger of continuing lower and tightening the stop limit will lower losses.
A stock trading system based on high profit/loss ratios and diversification
- A powerful trading system can be developed based on stock trades with high profit/loss ratio’s of at least 3:1 and diversification into 8 to 12 positions.
- This combination of diversification and high profit/loss ratio’s may mean that overall you have to correct only 33% of the time to breakeven. This is based on a typical 15% profit, 3:1 profit/loss ratio, 5% stop limits, and diversification into 10 positions with a constant $ loss (see note below).
- Finding stocks with even better profit/loss ratio’s, and being more aggressive on stop limits by adjusting them to at least breakeven once a move happens may mean overall you have to be correct only 16% of the time to break even.
- With such a robust stock trading system (solid foundation) the house becomes stacked in your favor and your long term profits rely less on the accuracy of your trading picks and more lenient on trading mistakes.
- To keep a constant dollar loss amount over all your 8 to 12 positions set the base loss % and trade amount in the Upside Recalc tool and to calculate the risk trade amount and number of shares.
Stock Breakout Trade
- Stock Breakouts are quick rallies that occur when it moves upward through a resistance area. Typically the next resistance will be far away or a new high area.
- A stock usually starts to rally and breakout once it moves above a trigger price. This trigger price is typically close to the upper edge of the current resistance area.
- Upon a breakout a stock can be expected to reach the breakout target price. Also listed is the stop limit and profit/loss ratio for the breakout.
- Breakouts vary in how quickly they rally and reach the breakout stock target.
- True Breakouts are the strongest breakouts made from type double or triple stock resistance areas and their rallies typically last a short time of 3 to 5 days.
- Continuation Breakouts are made from single resistance areas and their rallies typically last longer at 1 to 3 weeks.
Breakout Trade Tips
- Stock profit/loss ratios are higher (higher profit potential with tighter stop limits) on Watch Breakout types but they have yet to rally. If one can look at the 3 and 5 day intraday stock chart one may be able to observe accumulation and enter a position in anticipation of a confirmed breakout. If one does enter a position in anticipation of a stock breakout and a few days go by without one occuring one should tighten the stop to protect against a pullback.
- Confirmed breakouts typically have lower profit/loss ratios (lower profit potential with looser stops) but may have a higher probability of continuing higher. One may help prevent false breakouts by looking for strong buying volume on the 3 or 5 day intraday stock chart (and strong bullish 1 day Moneyflow) during the start of the breakout.
- Beware of breakouts with only one day of high volume followed by days of low volume (no follow through). If this occurs tighten the stop to lower loss for a possible false breakout.
- Stocks that are overbought may go even higher on a breakout.
- Screening for Confirmed breakouts and looking at the type of stocks (and their sectors/industry groups) can reveal where the current strength and money is flowing. Looking at which stocks are up on a down market day can also provide some insight.
- The end of a Breakout rally(top) may occur on a day with high volume(high 1 day Moneyflow) but flat price movement.
Back to help topics


