Stock Trading Charts
Post on: 2 Июль, 2015 No Comment

Stock Trading Charts
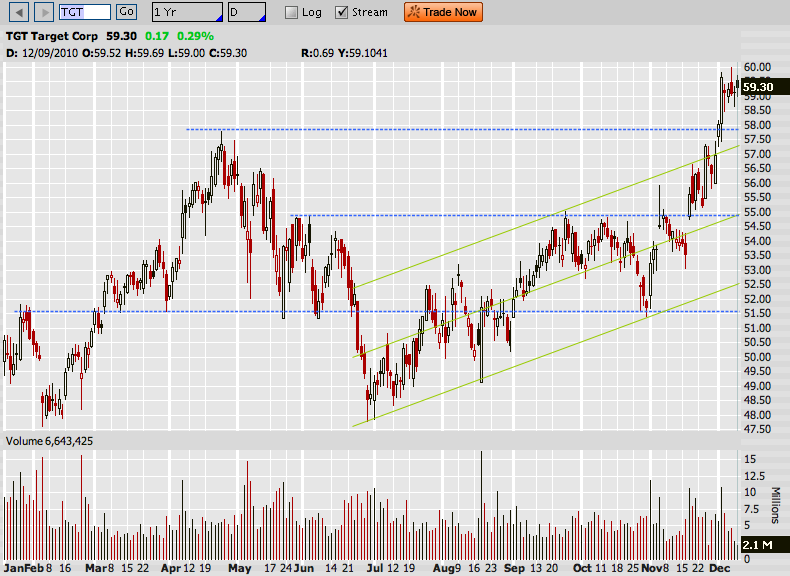
In stock trading, it is necessary to carefully analyze the position of stocks to be able to make enlightened decision on whether to buy or sell. Thorough stock analysis earns you income as well as minimizes risks to your capital. To do in-depth analysis, you need to use advanced tools such as charts for detailed scrutiny of the technical indicators of the stock in question: Bollinger bands, price channels, moving averages, envelopes, stochastic oscillators, relative strength index (RSI), MACD, OBV and others.
finance.yahoo.com/). These charts give the price history, moving averages and other important factors that will help you assess the value or risk in taking a position in said stock. Lets take a look at the more common charts being used by day traders: P&F, market profile and candlestick charts.
Point & Figure (P&F) charts provide a simple and clear method to determine the best time to buy and sell stocks. One of the oldest approaches to stock trading, the P&F method monitors supply and demand for each share, using the technical analysts approach in doing so. Designed for long-term trading to minimize costs, P&F charts is constructed with two axis that are both price-dependent, rather than one axis based on price and the other on date.
The unit price or point in a P&F chart may change value along the y-axis to reflect relative price movements. The chart is marked with X to show an upward movement in the price while and O indicates downward movement. The data in the x-axis, on the other hand, are taken from three-point reversals which occur when the price picks up three or more points while on a downward trend, or falls by three or more points if it is on an upward trend. Whenever a three-point reversal occurs, the chart is moved to the next column so that each column only shows movement in one direction. Traders prefer this charting method as insignificant price movements are filtered out.
Market profile chart or also called volume profile chart is common tool for day traders. It is useful in determining where most of the trading is occurring, together with the price of the stock being traded and at what time. Market profiles also provide data on the recent support and resistance levels of a stock.
Candlestick charts provide a raw analysis of price movements. Using intraday candles, day traders can easily spot entry and exits points that are essential in quick selling and buying of stocks. By analyzing the candlestick pattern in the chart, say a doji candle reversal pattern, and confirming the patterns behavior on technical analysis of orders and sizes for the stock, traders can easily get positions on a promising stock.
There are a lot more charts out there that are available to stock traders. Aside from those that are website-based, there are charts that are software-based while others require just some browser plug-in to retrieve data online and display it to you in chart form. The charts have specific uses and purposes, so traders usually utilize a combination of these charts in stock analysis.


