Stock Market Seasonal Trends – S P 500 Seasonal Trends
Post on: 21 Июль, 2015 No Comment

Stock Market Seasonal Trends– S&P 500 Seasonal Trends
By Cory Mitchell, CMT
Typically we look at charts in chronological orders, one day follows the next, one month follows another, and each year proceeds in sequence. The typical chart chronicles the price path of a stock, or a stock market index, over the years and can provide a lot of information for technicians to use. Yet, we can also look at a S&P 500 seasonal chart to gain insight into stock market information not readily available on standard charts.
So what are the S&P 500 seasonal trends, or an S&P 500 seasonal chart? For our purposes, seasonality is the tendency of stocks to bottom or top at certain points in the year.
Instead of looking at the last 30 years of stock market data in chronological order, what if you took each year (January to December) and could put each year on top of each other. All 30 years are then averaged and set to an initial value of 100 to provide one line which shows how the stock market acts on average between January and December, over the last 30 years (below we take a look at the 5, 10, and 15 years averages as well as the 20 and 30 year averages). Will the average show a stock market seasonal trend where the S&P 500 generally turns higher in certain months, or turns lower in others?
Below we look at the S&P 500 seasonal trends in the futures market. While you may not be a futures trader, seasonality of course affects stocks, the broader market which the S&P 500 futures represent, and the patterns can also be used to trade S&P 500 related ETFs such as the S&P 500 SPDRS (NYSE:SPY).
S&P 500 Seasonal Trends 5, 10, 15 Year
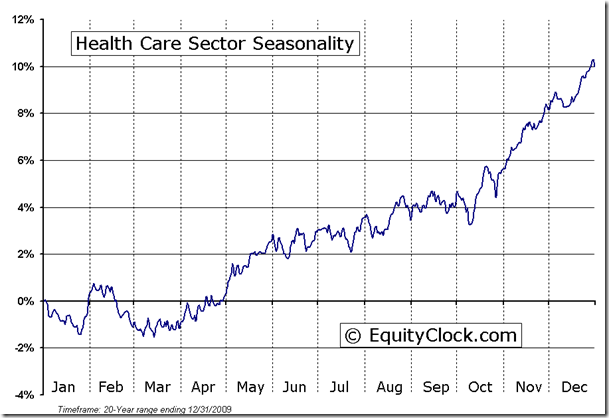
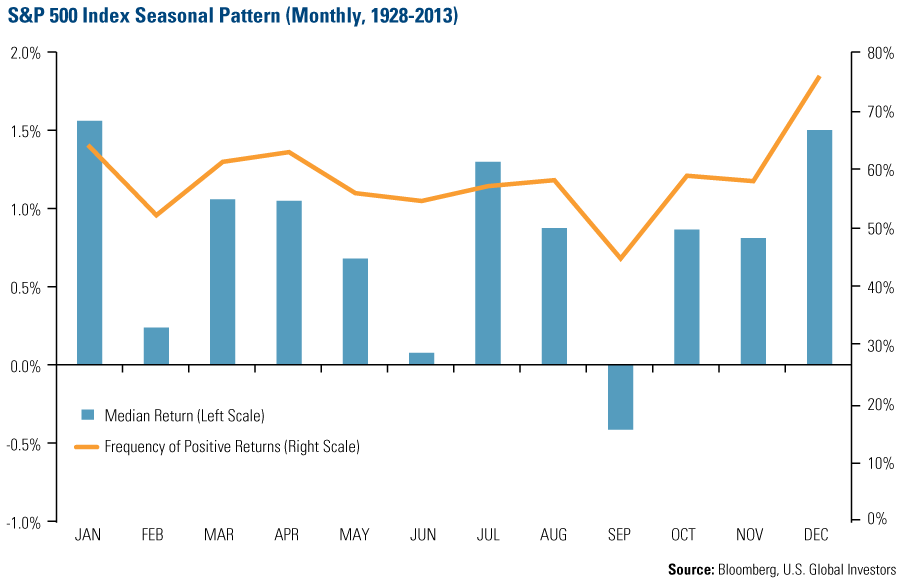
There are S&P 500 seasonal trends, and we can see them by looking at the following S&P 500 seasonal chart. The seasonal tendencies which will be extracted from the following charts can be used to provide a context for trades which occur within the year.
S&P 500 Seasonal Chart- 5, 10 and 15 Year
5/10/15 Year S&P 500 Seasonal Trends
Source: Signal Financial Group
The chart above shows the S&P 500 seasonal trends over the last 5 years, 10 years and 15 years. As we can see each average provides a different line, and this is important to understand about seasonality–it is an average, not a rule. In any given year price can deviate from the seasonal tendency and traders shouldn’t fight it . In early 2012 for instance we are seeing a divergence from the typical seasonal pattern seen in January and February. Despite this current divergence, seasonality is still a useful tool and we can extract the commonalities we see from the above three time frames (we are only looking for times when all three averages bottom, top or move together) to find likely turning points in the future.
- Market usually move lower through the first couple months of the year, putting in lows early to mid-March and then head higher in mid-May.
- The middle to end of May is usually weak followed a short rally into early June which could potentially reach May high levels, but not always (hence the Sell in May and go away saying).
- Beginning of June is also often a short-term peak, followed by a decline into at least early July.
- Mid-September to early to mid-October is generally weak.
- Stocks usually bottom out again in mid-November and rally into the end of the year.

S&P 500 Seasonal Trends -20 and 30 Year
By expanding the time frame we can see which of the tendencies listed above also align with the longer-term S&P 500 seasonal patterns over the last 20 and 30 years.
S&P 500 Seasonal Chart- 20 and 30 Year
20/30 Year S&P 500 Seasonal Trends
Source: Signal Financial Group
With this much data the trends are much less choppy. We can see clearly the times when stocks generally bottom and top during the year. Lets look at the seasonal trends based on the 20 and 30 year time frames. Then in the summary we will look at which trends are present in on the 5, 10, 15, 20 and 30 year seasonal chartsproviding us with the most reliable turning points. Here are the tendencies based solely on the 20 and 30 year chart.
- Stocks start off the year lower and then bottom in late January. Rally kicks in by (possibly before) mid-March.
- Top out in late May or early June.
- Middle of August to end of August is usually a rally time, potentially putting in new highs.
- Middle of September to middle of October is a bearish time.
- Middle to late October stocks turn higher and go higher into the end of the year.
Strongest S&P 500 Seasonal Trends
Using all the time frames we can isolate the highest probable turning points. I again point out this is an average not a rule. 2012 has so far bucked one of the strongest seasonal trends (listed below), so in one year anything can happen. That said here are the dominant patterns which have, on average, occurred on all time frames discussed.
- Mid-March to mid-May is generally a bullish time.
- Mid-September to Mid-October is generally a bearish time.
- Mid-November into the end of the year is a bullish time.
Why Should You Care?
When looking to buy stocks, the seasonal patterns can aid in timing those purchases so stocks are bought during high probability time of overall stock market appreciation. It can also signal potential exits if the trader does not want to hold through a time that is usually bearish. Investors can use this information to buy stocks on dips at certain times of year. Swing traders can also take advantage by making trades in alignment with the seasonal patterns of the market and exiting before probable turning points.
It is important to keep the overall trend of the market in mind. In uptrends use seasonal low points to buy stocks. In overall downtrends, use seasonal high points to get short or to sell.


