Stock Market Momentum Indicator
Post on: 2 Июль, 2015 No Comment

— Stock Market Momentum Indicator
The Commodity Research Bureau has been calculating and publishing its own proprietary stock market indicator for years. Traders who have invested the time to become familiar with the indicator’s behavior and uses have found it to be an invaluable tool for determining the general direction of stock prices.
The Stock Market Momentum Indicator analyzes the price strength of the 500 stocks in the S&P 500 Index.
How the indicator is determined
Using a proprietary formula, a ratio of the percentage of designated stocks currently trading above their respective 50-day moving averages is computed. This number is reported daily as the ratio and is the basis for all other calculations. Two moving averages of that ratio are also calculated and reported, a 10-day and a 25-day. The movement and behavior of these two moving averages defines the value of the Momentum Indicator for determining the general market trend.
In its simplest and most basic interpretation, an uptrend is signaled when the 10-day moving average crosses above the 25-day moving average and the 25-day moving average turns up.
Conversely, a downtrend is signaled when the 10-day moving average crosses below the 25-day moving average and the 25-day moving average turns down.
The Momentum Indicator is prone to signaling many turns, especially when the underlying stock market is confined to a narrow trading range. In 1994, five buy and four sell signals were generated.
A couple of checks will help filter out false signals.
First of all, the closer to 0 or 100 the 25-day moving average is at the turn, the more reliable the signal will be. For example, a turn down by the 25-day moving average from 90 will provide a far more reliable sell signal than a down turn from 58. On the other hand, a turn up by the 25-day moving average from 15 will yield a more reliable buy signal than a turn up from 40. Personally, for optimal signals, I prefer the 25-day average to be between 0-35 for buys, and between 65-100 for sells.
Other methods of filtering out false signals include using overbought/oversold indicators to measure the likelihood of a trend change at a given time. Also useful are weekly bar chart reversal formations for technical confirmation of a trend reversal.

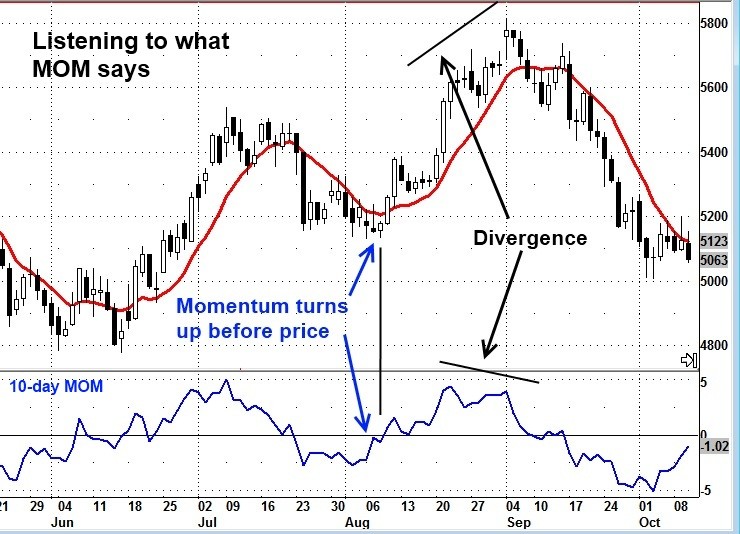
In addition, the Stock Market Momentum Indicator displays divergence patterns that can be used as additional verification of signal reliability.
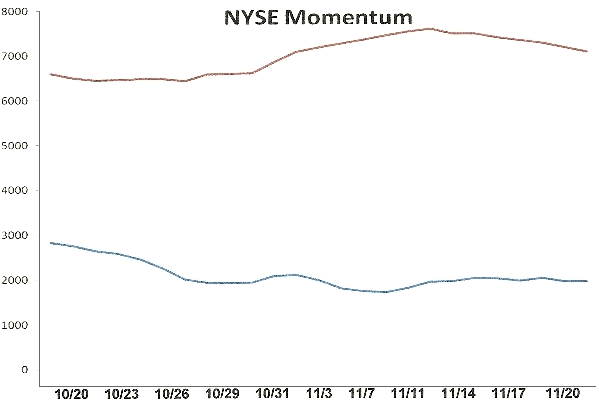
The Accompanying charts show the last two-year history of the CRB Stock Market Momentum Indictor, the S&P 500 Index and the Dow Jones Industrial Average. As you can see, the three sell signals early in 1993, with the 25-day moving average caught between 48-63, were best ignored. However, the sell signals in February and September 1994, with the 25-day moving average near 70, were both worth acting upon.
Like any other technical market indicator, it takes time and practice to learn its quirks and peculiarities before it becomes a useful tool. However, as I have stated in nearly every column, the more weapons in your arsenal, the more successful your trading is likely to be.
The Stock Market Momentum Indicator is published in the CRB PriceCharts and Commodity Index Report.
- Charts and Data


