Stock Market Long Term Technical Indicators
Post on: 16 Март, 2015 No Comment

The following are remarks accumulated during the past year which help reflect on what is happening in the market now. If some appear outdated, it is only because these remarks are accumulated as the market has been trading during the past year. Looking back at these remarks as they were written help form an overall view of the stock market as events unfold.
ADVANCE DECLINE LINE:
This indicator, the cumulative number of issues advancing over the number of declining issues on the New York Stock Exchange has been bearish since the end of 1998. At that time the Dow Industrial Average, along with S&P 500, the NASDAQ and other major averages went on to new highs while this indicator held back and has been in a declining trend since.
Up until that time, this line was in the same major uptrend as the major averages — while the market averages were rising, this majority of issues were also rising. This was the first major divergence possibly indicating a change might be lying ahead.
This indicator has been used and respected for the past century.
DOW JONES TRANSPORTATION AVERAGE:
Here is another important divergence. This index hit its high of about 3,800 in May 1999. Since then it has mostly been in a declining trend. When the Dow Industrials hit its high in January 2000 the Transportation Average had already lost 20% of its value. Up until that time both these averages had trended higher together.
The divergence in these two averages was considered by Charles Dow (the architect of the Dow theory and the Dow Averages) over a century ago to be an ominous warning of a possible change ahead, and this divergence is an important part of the Dow Theory. It has been a reliable and respected indicator since. Click here to read about the history and confirmation of this theory DJTA History .
Now at about 2,400 (a loss of 37% during the past year) the Transportation Average is a long way from where it was a year ago.
Volume is an important indicator of a potential change in direction. Continuing high volume often is the beginning of a new trend or the end of an existing one.
Volume started building noticeably in 1997, gradually increasing in 1998 and 1999 and with a peak in the months between December 1999 and May 2000, trading 3 or 4 times as many shares as what was previously considered normal volume.
This pattern of extreme volume coming after a bull market that has lasted for years is typical of the end of a long term trend. Now volume has subsided in the past month, indicating the peak (some would call it the blow-off) has probably already come. Click on one or both of the following links and scroll down to the bottom part of the chart to see the recent volume trend: DJ Industrials or NASDAQ
The trend of prices itself is an important indicator. Prices that show lower highs and lower lows are what we usually see in a declining market (just as higher highs and higher lows constitute a rising market). Rallies in most stock indexes since January 2000 have not been able to reach previous high levels and some indexes (NASDAQ most notably) have declined ruthlessly.
Now the NASDAQ is over 35% lower than it was just a few months ago. A continued decline in the NASDAQ, the Transportation Average, increasing frequency of triple digit losses as well as the steep losses in some individual stocks, weakness in other world markets is causing a loss of confidence that could snowball.
Also keep in mind that the losses in a bear market usually have a relation to the gains realized during the preceding bull market. A market that has tripled is much more likely to experience larger losses than a market that has gained less. The bear market of 1973-74 gave back 50% of its gains and of course the 1929-32 bear market gave back 90% (yes, 90%). Therefore the relatively small losses which we are seeing now (the 35% loss in the NASDAQ for example) may only be the beginning of much larger potential losses, especially considering the poor state of corporate earnings in relation to stock prices.
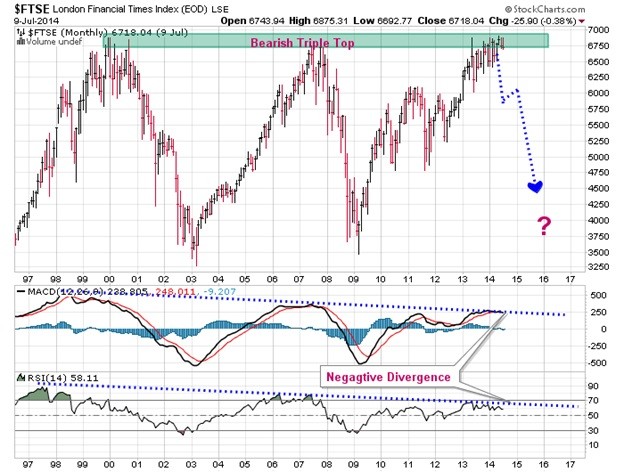
An interesting aspect of the prices now, is the potential head and shoulder formation in the long Term Dow coming together with unusually high volume, very typical signs of a final blow off. Similar formation is showing on the London London FTSE chart. If the neckline of this formation is broken, i.e. a sustained break below 10,000 in the Dow (or below 6,000 in the FTSE), it is considered extremely bearish because these formations have preceded large declines before — they are well known by market technicians.
The prices of some stocks have fallen sharply. Stocks such as AT&T, General Motors, Microsoft, America on Line, Amazon.com, Eastman Kodak, Eli Lilly & Co. and others have lost as much as half of their value or more. These are not things that we see in a bull market — they are what we see in a bear market. Click on one or both of the following links to see recent market activity in the context of the past decade: DJ Industrials or NASDAQ .
EARNINGS:

Most important are the fundamentals . The Dow Industrials are selling at over 20 times earnings, the S&P index is selling at an absurd almost 30 times earnings — and no one knows at what ridiculous heights the NASDAQ is at.
Another factor may be the change in how earnings are reported. This came to the forefront recently when it was reported that Amazon.com (previously one of the market’s leaders, but now is almost two thirds under its value in December) included in its earnings, shares of other companies which it received as compensation. The shares which it received subsequently dropped in value, thus rendering previous earnings reports invalid.
The reporting of earnings at one time was based on how much money a company took in from its business, less the expenses of operating the business, the net figure then representing earnings of a company. This is quite simplified of course, but some of the liberties with which some companies have reported their earnings, based on abstract theories, boggles the mind. The stock averages are already selling at huge earnings multiples, based on earnings which have been reported, but earnings which are often based on new, questionable accounting theories, often changing to meet circumstances.
Also, we often wonder for example, why the earnings of so many companies beat the estimates by one penny. How can companies dealing in hundreds of millions dollars come so close to their earnings estimates? Is this real or are figures tailored to keep stock prices up?
Price earnings multiples, although accepted for a long time, are nonsensical. With uncertain political changes ahead, and considering that the Dow has more than tripled since 1993, there is good reason to consider what the technical indicators are showing.
These are all fundamental factors, when combined with the present technical outlook, which will help topple the stock market from its present sky high levels.
The trend in foreign stock markets is not usually used as a technical indicator. However, several weeks before the 1987 crash, all of the world’s major stock markets were in decline, along with the U.S. market, so they bear watching. There is a strong similarity to the 1987 trends now.
The long term upward trend in the major European markets leveled off and turned down in recent weeks after a decade of rising prices. The London and Frankfurt Stock Exchanges are trading well under the highs they made earlier in the year (as the U.S. stock market averages are also doing) the Paris market is still under its highs although not as badly, and other smaller markets are leveling off. The only markets we can find that are still hanging in there are the Toronto and the Swiss markets, but no doubt they will soon catch up to the rest of the world. London FTSE German Stock Market
The Japanese stock market which has been following different trends in the past several years has nevertheless declined sharply since April, losing over 20% from its highs earlier this year and close to its lowest point in a year and a half. Click here for a look at Tokyo trading during the past two years: NIKKEI INDEX . It has suffered a sharp decline since April.


