STOCK MARKET CRASH ALERT
Post on: 17 Май, 2015 No Comment

The DJIA is approaching the psychologically important 11,000 mark on the downside:
My warning for a stock market crash last fall based upon astroharmonics and seasonality was premature. In response to Federal Reserve efforts to rescue the stock market and economy from collapse by cutting interest rates, stock prices rebounded with the DJIA reaching a new all-time high above 14,000 in early-October of 2007. Since peaking at Dow 14,000, however, federal authorities have pretty much used up their magic bullets in combatting the onset of collective depression and a secular bear market has begun. In the wake of bailing out Bear Stearns in March and Fannie Mae and Freddie Mac in recent days, Uncle Sam has effectively doubled the national debt trying to stave off the inevitable bust from America’s manic boom.
According to the Elliott Wave Principle. this may be a Grand Supercycle or even Millenium Cycle collapse now underway. My current wave count indicates that a reversal below Dow 11,000 in the near-future may be the beginning of a historic crash that could outline the collapse of Western Civilization.
- DOW THEORY BEAR MARKET SIGNAL -
Before getting into Elliott Wave specifics, let’s first examine stock market patterns in the context of Dow Theory.
Unlike the first top at Dow 14,000 in July of 2007, the peak in the Dow Industrials last October was not confirmed by the Dow Transports and Utilities, something you’d expect to see at the final top according to Dow Theory. As can be seen below, the Utilities peaked late last year and the Transports had peaked last July:
On November 21st of last year, a Dow Theory primary bear market signal occurred when both the Dow Industrials and Dow Transports closed below the prior August 16th 2007 lows in the indices. The record of the Dow Theory is impressive. According to one statistical analysis. if you had bought and sold stocks based upon Dow Theory buy and sell signals from 1897 to the year 2000, you who have achieved a return ten times that of simply buying and holding during the same period.
One should note that on June 6th, the Dow Transports reached a new closing all-time high unconfirmed by the Industrials and Utilities and then turned sharply lower. This is a Dow Theory non-confirmation that buttresses the case that a secular bear market is underway .
- THE GRAND SUPERCYCLE TOP -
The scale of the bear market that might have been signalled by the Dow Theory sell signal in late-November of 2007 is suggested by the Elliott Wave Principle popularized by Robert Prechter and Elliott Wave International over the past three decades. If you are unfamiliar with the Wave Principle, there are excellent online tutorials to help you better understand it .
According to the Wave Principle, the cyclical top reached in stock prices in October 2007 could have been a Grand Supercycle peak some 200 years in the making. In fact, there is even reason to believe the top reached was the peak of a Millenium Cycle, i.e. it signified the peak of Western Civilization. To better understand why this is so, please watch the following presentation I gave on Cambridge Community Television in 2000 and keep in mind that the peak ended up occurring in the Fall of 2007 instead of the Spring of 2000 as I had believed at the time (although the speculative peak as measured by the Nasdaq Composite did occur in the Spring of 2000):
If indeed a Grand Supercycle turning point in world history recently occurred, then the largest bear market in human history is now unfolding. If so, this implies the crash of Western Civilization has begun. That this historic reversal is now underway is suggested by the fact that the DJIA’s drop below 12,000 entailed breaking below the lower trendline for the bull market in stocks underway since the ’87 Crash:
Furthermore, the lower trendline from the 1982 low has been violated signifying the beginning of the Grand Supercycle bear market:
As for the Grand Supercycle Crash, the recent Elliott Wave patterns suggest this may be imminent. Below is the image from the June post of my Stock Market Crash Alert article :
As can be seen above, the DJIA peaked above the psychologically important 14,000 mark in October, reached an intermediate wave-(1) low in March with the collapse of Bear Stearns and then a wave-(2) rebound to the 13,000 mark occurred into May.
Following the intermediate wave-(2) peak in May, a sharp drop occured to Dow 11,000 in July after which a minor wave-2 rebound occurred. This pattern is now completed and we appear to be entering wave-3 of wave-(3) down at the current juncture, i.e. the Grand Supercycle crash wave. Please note that I had earlier warned that the Grand Supercycle crash wave might unfold by the late-summer or fall:
July Update : According to my current Elliott Wave count we have started wave-iii of wave-1 of wave-(3) down. This indicates a sharp sell-off has started. While this might mean a full-scale crash in the immediate future, the greatest potential for a full-scale mass panic will occur with wave-iii of wave-3 of wave-(3) which should occur around the late-summer or fall.

My specific Elliott Wave count at the current juncture is indicated below:
If this wave count is correct, the stock market is now in minor wave-3 of intermediate wave-(3) down. Confirmation of this wave count would occur with a decisive drop in the DJIA below the wave-1 low at 11,000. If, indeed, the Grand Supercycle peak was reached in October 2007, a break below Dow 11,000 in the days ahead would imply that we have entered the Grand Supercycle crash. This implies the crash of Western Civilization in the coming weeks.
- THE HISTORICAL PATTERN OF DOW THOUSAND MARK PSYCHOLOGICAL BARRIERS -
As I’ve explained over and over and over and over and over and over again in prior articles, when the DJIA reverses from psychologically important thousand marks, negative historical events tend to follow.
Historically, when the major stock averages, and the DJIA in particularly, reach or trade around psychologically important round numbers like thousand marks, the stock market may top-out and, failing to hold near or above the mark, sharply reverse course. A remarkable feature of these stock market reversals at thousand marks in the DJIA is that they are often associated with negative news that follows the market top.
For instance, on September 6th of 2001, the DJIA fell decisively below the 10,000 mark. THEN September 11th occurred driving the market down sharply:
Thus, when the DJIA reversed decisively from 10,000 in September of 2001, the breakdown in Western confidence manifested as the literal collapse of a key symbol of Western financial prowess and American global economic hegemony. the World Trade Center towers in New York City. Likewise, a blow occurred against the Pentagon in Washington DC, the symbol of American global military hegemony.
There are other major examples of significant negative historical events erupting in conjunction with reversals from key thousand marks in the DJIA.
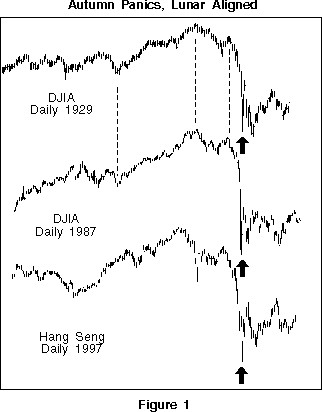
Right after the DJIA failed at Dow 8000 in late-October of 1997, a mini-crash occurred in association with a financial panic in Asia.


