Stock Market AnalyzerPredictor SMAP3
Post on: 30 Май, 2015 No Comment

software tool that helps traders and investors to find an optimal timing by analyzing and predicting stock market cycles
SMAP-3 Features
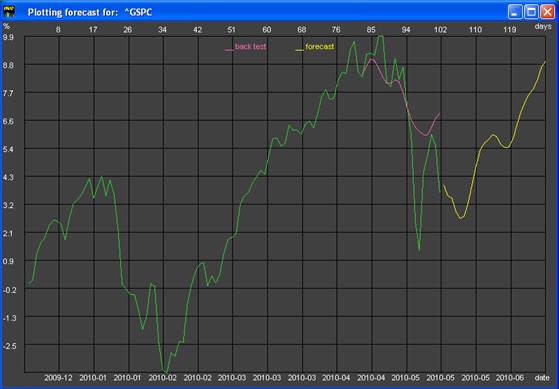
Plotting historical and forecasted data
Using statistical analysis to find optimal timing (month of year, day of month, day of week)
Simply How SMAP-3 Works
The algorithm of using SMAP is simple — select input data, process data, and view results. The input data are historical quotes of the stock market indexes, ETFs, funds, well-traded shares, etc. for any period from around one year to more than 40 years. Data are provided by users.
All calculations are done by clicking Processing > Performing Analysis . The calculations can take from a few minutes to an hour depending on the analyzing data period and performance of your PC.
Output results are spectrum of historical quote cycles, forecasted performance, and statistics of average prices (depending on month of year, day of month, and day of week).
SMAP-3 Short Description
The stock market does not follow just a linear trend — it has some deviations from a linear function. Some cycles are well-known, such as, four-year presidential cycle, annual and quarterly fiscal reporting cycles, etc. In addition, some cycles are defined by intrinsic characteristic properties of the system. The stock market performance curve can be considered as a sum of the cyclical functions with different periods and amplitudes. It is not easy to analyze the repetition of typical patterns in stock market performance because cycles mask themselves — sometimes they overlap to form an abnormal extremum or offset to form a flat period. It is clear that a simple chart analysis has a certain limit in identifying cycles parameters and using them for predicting.
Addaptron Software has developed Stock Market Analyzer-Predictor SMAP, computer program, which is able not only to extract basic cycles of the stock market (indexes, sectors, or well-traded shares) but also to predict an optimal timing to buy or sell stocks. SMAP calculation mainly based on extracting basic cyclical functions with different periods, amplitudes, and phases from historical quote curve. To detect correctly major cycles, the historical price data are transformed from time domain to frequency domain (spectrum).
At the beginning, instead of calculating the prediction for the time period forward, SMAP does a simulation of forecast on relevant past data in order to estimate the accuracy of prediction with certain parameters (such simulation called back testing — the process of evaluating prediction on prior time periods). Then it calculates the prediction for the time period forward using internal optimized parameters. Back testing also allows finding an optimal time frame. The more difference between actual curve and forecasted, the worse prediction accuracy is.
By selecting data with different historical periods, user can identify the major cycles, which have a dominant effect in a particular time frame. To build an extrapolation (predicted curve), SMAP uses the following two-step approach: (1) applying spectral (time series) analysis to decompose the curve into basic functions, (2) composing these functions beyond the historical data. Additionally, SMAP enables finding optimal timing to buy/sell by analyzing months of year, days of month, and days of week (the calculation is based on statistical analysis). Also it can be used for intraday trading (no source data provided).
SMAP has a user-friendly easy-to-use interface. This software is intended for investors with a basic knowledge in stock investing.
Advanced Option
SMAP-3 has a simple portfolio management that helps to perform a forecast comparative analysis. Also it has an advanced option that allows:
- Using a pure cycle analysis without additional methods and adjustments
- Decoupling the fitting area (time interval where solution is searched) from historical data
- Predetermining the period values and number of cycles to be included in the solution
- Estimating each cycle statistical stability within selected historical period
- Estimating the deviation of a solution from actual data in both areas — fitting and including unused (one can see the solution data set compared to a selected historical time interval whether or not a whole historical time period was included in the analysis)
- Using linear or logarithmic scale to calculate the solution and plot the chart
- Using the price value in absolute units ($) or in percentages (relative to minimal value)
- Working with expandable chart scale
Some additional info is available on Q & A page. The detailed description is presented in User’s Manual (accessible from menu Help after downloading and installing SMFT-1).


