Stock Charts
Post on: 3 Июнь, 2015 No Comment

Stock Charts
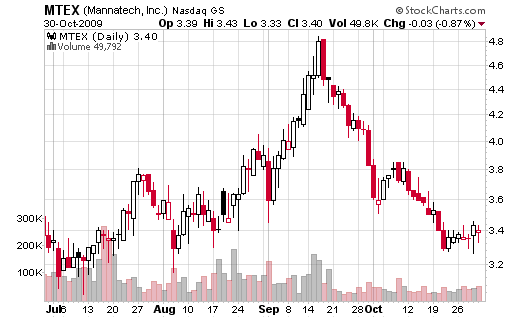
Our v-charts for stocks, ETFs, and indexes trading are considered the best stock charts solution on the web. We have most advanced charting tools which includes saving chart styles, analytical drawing on the charts, streaming real-time quotes, chart alerts and other chart’s accessories. If you open any of our stock charts you will be amazed how simply advanced technical stock analysis tools could be used. You may compare stockcharts to our services and you will see that our technical stock chart will put you on the edge of stock technical analysis. Our stock market technical analysis will deliver you deep insights of the market movements. Volume and volatility adjustment will assure you are on the right track and your trading will become more confident. Give it a try, start using our professional technical analysis charts and you will not regret. We have the best index and stock charts for volume and volatility technical analysis. Check our selling /buying volume and Volatility adjusted indicators
1. We have everything that you may find with other chart providers
2. We have something that nobody has
(volatility, volume and advance/decline proprietary indicators for stocks, ETFs and for the S&P 500 and other indexes)
3. We are mobile
(our charts are accessible anywhere you go as long as you have access to a computer, Smartphone, tablet. )

Have you ever run into a situations when after a nice profitable trade your trading system starts to generate number of bad signals in a row? Even a loss is not a big on each of them, together, in many cases, these signals wipe out most of the previously earned profit.
Did you ever had periods of bad trading when your technical indicators reacted on changes in a trend whether too early or when it is already too late?
The answer on these question is VOLATILITY!
Stock market is in the constant change and the main reason most of the technical indicators and studies stop working during certain period of time is that a stock, index or ETF (Exchange Traded Fund) you trade became more or less volatile. A trader usually set his/her trading strategy or system to react on certain indication with a certain sensitivity which would allow him/her to avoid choppy trading, to enter a trade with some delay when change in a trend is confirmed and to exit a trend when a certain risk level is hit.
Everything would be ok if the stock market would be the same all the time. However, it is not the case. When volatility increases, the price starts to change its trend stronger and faster. In order do not to run into a choppy trading or when its too late to react on trend’s changes, you have to change settings your technical indicators and on your trading system. When volatility decreases you have to change your system’s settings again or you may risk to run into side-way choppy trading or your technical analysis will signal about trend changes when there is no one.


