Stock Chart
Post on: 16 Март, 2015 No Comment

Stock Market Graphs
Reading a stock market graph allows to evaluate intelligently a potential stock purchase with the use of price histories. This is a form of technical analysis wherein it employs the prior price or trading volume statistics predicting movements of future stock price. The three common types are point and figure charts, line graphs and candlestick charts indicating data patterns. If you know how to read them, you can apply trading rules through the basis of data. Using a stock graph improves your timing on entry and exit on stock positions from solid information than emotional anticipation.
Line Graphs
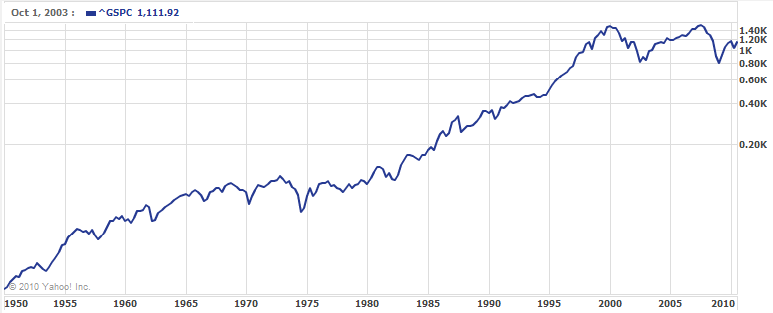
· Locate the dates on X-axis and the price ranges on Y-axis. A price range of stock is a vertical line that range from the lowest trade price to its highest of the day. Most versions of line graphs also show the opening and closing price.
· Avoid trading when there is low volume. Control your decisions when it comes to buying and selling to prevent placing on trades based on a low volume day. A line graph of price-volume describes daily trading volume on its base. The trading volume is presented with a vertical line. If the line is taller, it means the volume is high. You can have more trust on any trade signals for that day.
· Identify downtrends and up trends. Point and figure charts are grids which use X for prices that are rising and O for falling prices. Every box on the grid represents close range of prices filled with X or O alternately reflecting alternating trends. Point and figure chart columns display movements of prices without concern to time periods.
· Take profits when the point and figure chart reaches price objective. A price objective is a horizontal line that you add to the point and figure chart indicating a price wherein one would be willing to sell a stock. Wise investors take all or some of its profits when a certain price objective is reached.

Candlestick charts
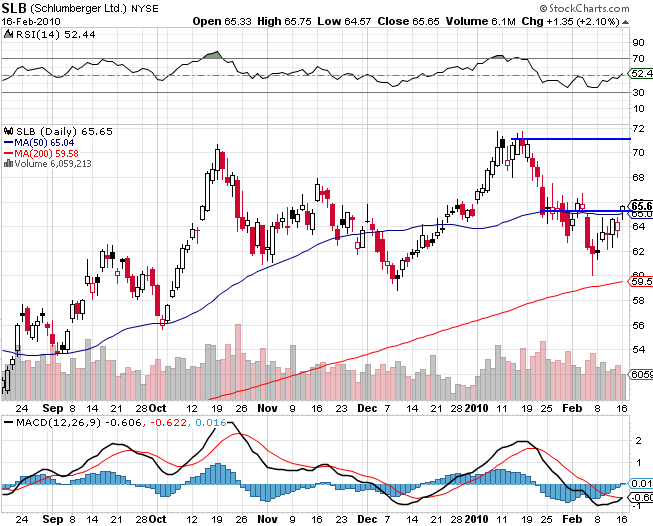
· Identify the range of trading of a stock. Candlesticks are images which depicts a single time period of the price trading range of a stock. It consists of rectangular candle body with a top and bottom vertical wick called shadows extending from the body. The top and bottom of the body represents the opening and closing price of a stock. The tip at the top shadow is the high price of stock per day. The tip at the bottom is the daily low. If the stock closes high in that day, the body is color green or red otherwise.
· When the candlesticks break in support, sell the stocks. Levels of support connect the range of shadow bottoms of candlesticks for a given period of time.


