Stock beta calculation
Post on: 22 Май, 2015 No Comment

Normally investors aren’t interested in day trading. They’re interested in returns on the time scale of years. Suppose there’s a stock you want to invest in. It promises high returns but you’re concerned about volatility, which measures risk. Here we go through an example of a stock beta calculation. commonly used to assess risk.
Investors are interested in quantifying volatility based on fairly standard measures of investing. One is the S&P 500 index. You might want to know what is the volatility of a stock (or bunch of stocks) in comparison to this because it’s a known and fairly standard thing to invest in.
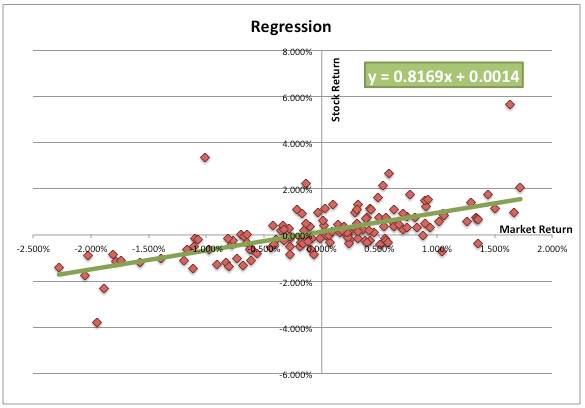
To compare the two, you can plot the history of month to month returns for both the S&P index and the stock over say the last few years (e.g. 5). To be accurate, you should also include the dividends in the profit you get. You’ll get some sort of plot similar to what we saw before when talking about linear regression:
Here the straight line is the best fit linear regression fit to the data (see section 1.8.2 ). For the ith month, let’s call the S&P index returns and denote our hot stock by . Then the best fit line is
Of course this isn’t because it doesn’t fit the data exactly. There are really quite substantial errors, so as before, we know the errors . that is the difference between the true return and it’s linear fit.

Now the value of is the slope of the straight line. For example take . It says that if the S&P index fluctuates down by say 1%, then the hot stock will down by 1.5% some error. Same if the index fluctuates up by 1%. Then the stock is expected to fluctuate up by 1.5% some error.
How do we interpret beta ( )? It doesn’t really represent the volatility of the stock. For example suppose we had a stock trading on planet Bok in a galaxy far far away. It might be incredibly risky with its top executives ice climbing for fun everyday while completely stoned. But its value for is expected to be zero ( error). That’s because the fluctuations in the S&P on earth will have nothing whatsoever to do with what’s going on planet Bok. So this interpretation of beta is clearly not correct.
The calculation of beta for a stock is still informative. It tells you how fluctuations in the return of stock co-vary with an index. That can be quite important, but it is often completely misused. If you want to know how risky an investment is, look at the volatility directly. You can get this by looking at how much the value of a stock varies in a month (or any time period), and then use the equation for a random walk as we did in section 2.12.1 to calculate what the risk will be after a year.
As I’ve said before, many discussions of how to do a stock beta calculation and the meaning of are quite flawed and you should try to understand the statistical concepts of correlation (section 1.8. linear regression (section 1.8.2 ), and random walks (sections 1.7 ), 2.12 ), before using it, especially to make investment decisions.


