Small Cap Rally in Peril Safer Alternatives
Post on: 23 Июль, 2015 No Comment

by Carla Fried December 02, 2013
For all the attention given to the record-level ascent of the S&P 500 this year, it’s small caps that have truly been on fire, as shown in this chart of the SPDR S&P 500 ETF (SPY ) and the SPDR S&P 600 Small Cap ETF (SLY ).
The small cap outperformance this year is just a continuation of what has played out since the financial crisis; small caps are more than 100 percentage points ahead of big stocks over the past five years.
A generic discussion of whether we are in a bubble or not is rather pointless; the more important question is what pockets of the market may be looking a tad overdone. And when you start looking for specific bubble-ish segments, small cap is pretty much screaming out for some profit-taking and rebalancing.
According to the Leuthold Group, the five-year normalized PE ratio for small caps hit 29x earlier this month. That’s just a smidge lower than the record high of 30.3x of September 1997.
Moreover, when you take a longer view of the smallcap/large cap comparison, Leuthold notes that the small cap Russell 2000 index has merely matched the S&P 500’s total return since 2006.
The thing is, while just keeping pace with the return for large caps, the small cap’s normalized PE ratio relative to the S&P 500’s PE ratio has grown from a 13% premium to 38%. As Leuthold’s Doug Ramsey noted in a recent report: “We think the current Small Cap premium is very near a peak. But that’s just a forecast. Probably more sobering is the fact that in the past seven years a huge relative PE expansion has produced so little in the way of Small Cap excess performance.”
And that high small cap p/e is looking especially vulnerable given where we’re at in the economic cycle. As BlackRock chief investment strategist Russ Koesterich recently pointed out, small caps are the primary beneficiaries of accommodative Fed policy that is at its core pushing the “risk on” trade. “The intuition is that these companies, along with other risky assets, typically perform best in an environment when monetary policy is very accommodative—evidenced by low real rates—and investors are in a “risk seeking” mode. During these periods, small and mid cap companies tend to trade at higher valuations relative to larger, more stable companies. As real rates rise, valuations relative to large cap firms tend to decline.” And as the Leuthold data suggests, there’s a lot of room for those valuations to fall given their current levels.
If you’re inclined to take some profits in small caps, Koesterich went on to point out that large and mega caps tends to withstand rising real yields better than small caps.
The Vanguard Mega Cap ETF (MGC ) has a forward p/e of 16 compared to nearly 20x for the Vanguard Small Cap ETF (VB ). Six of the portfolio’s top 10 holdings have p/e’s below the market average: Apple (AAPL ), Exxon Mobil (XOM ), Microsoft (MSFT ), Chevron (CVX ), Wells Fargo (WFC ) and Berkshire Hathaway (BRK.B ).
Turning to the YCharts Stock Screener. ranking the 100 largest by trailing PE ratio and then checking for positive operating earnings over the past year pulls up a motley crew of Chinese and Russian operations whose fates are tied to a less than transparent financial systems, and a bunch of very out of favor global energy and tech behemoths, including once again Exxon Mobil and Chevron, as well as Intel (INTC ) and IBM(IBM ). There’s no free lunch in the bunch: they’re cheap for a reason, be it cyclicality (energy) or transformational struggles (Intel, IBM and just about every old tech company.)

Adding another screen for shareholder yield. points to a few of the out-of-favors that are still managing to deliver current value to shareholders.
Pfizer’s 3% dividend yield is higher than the 10-year Treasury yield, but it’s the aggressive buybacks that are fueling a high 11% shareholder yield.
Even if buybacks were to slow as the stock price has rebounded, Pfizer has a long history of buybacks other than during its big crater during the financial crisis.
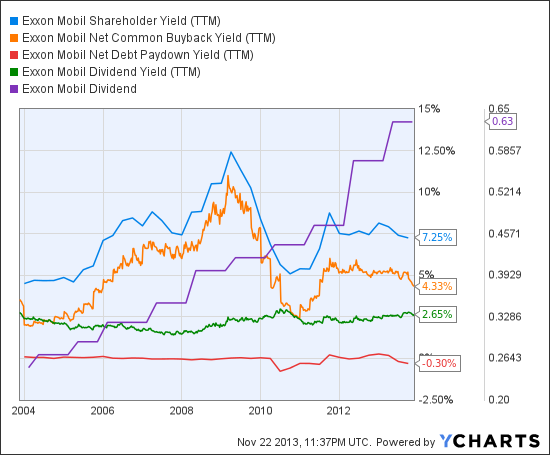
Exxon Mobil is an even more table story: dividend growth has been uninterrupted over the past decade, the current yield is above the S&P 500 average, and buybacks are clearly part of a long-term capital allocation plan. Add it up and there’s a compelling shareholder yield that hasn’t dipped below 5% over the past 10 years.
Oh, and Exxon Mobil’s 5-year trailing PE (PE5 at YCharts ) is less than half the average for the small cap universe tracked by Leuthold.
Carla Fried, a senior contributing editor at ycharts.com, has covered investing for more than 25 years. Her work appears in The New York Times, Bloomberg.com and Money Magazine. She can be reached at editor@ycharts.com. Read the RIABiz profile of YCharts. You can also request a demonstration of YCharts Platinum.


