Short Term Stock Trading Strategies Trading With Oscillators
Post on: 30 Июнь, 2015 No Comment

Both The RSI And Stochastic Can Help You Create Profitable Short Term Stock Trading Strategies
I typically receive dozens of emails from traders who are just starting out asking me for help in creating short term stock trading strategies. A few weeks ago I demonstrated a strategy using the RSI indicator; I received several emails from readers asking me to explain the difference between the RSI Indicator and the Stochastic Indicator.
Without getting into complex mathematical formulas, the RSI indicator measures the momentum or velocity of price movement or in plain English the RSI indicator measures when prices moved too fast too soon. The Stochastic Indicator on the other hand is a measurement of the placement of a current price within a recent trading range. The theory is that as prices rise, closes tend to occur nearer to the high end of their recent range. Conversely, when prices drop, closes tend to be near the low end of the range. This is how the Stochastic Oscillator measures price levels.
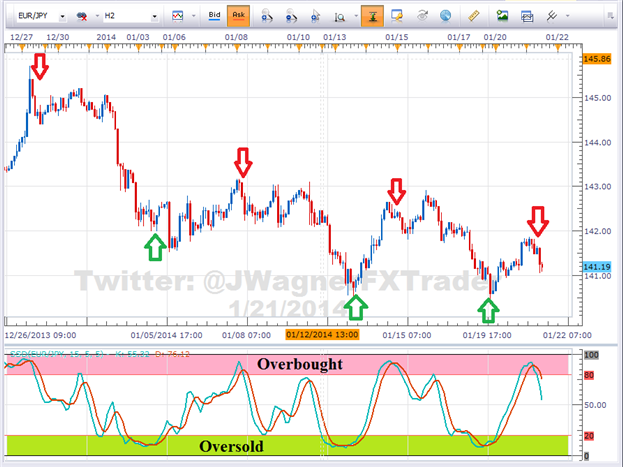
Both indicators are considered momentum oscillators because their primary role in most short term stock trading strategies is to locate overbought and oversold market conditions.
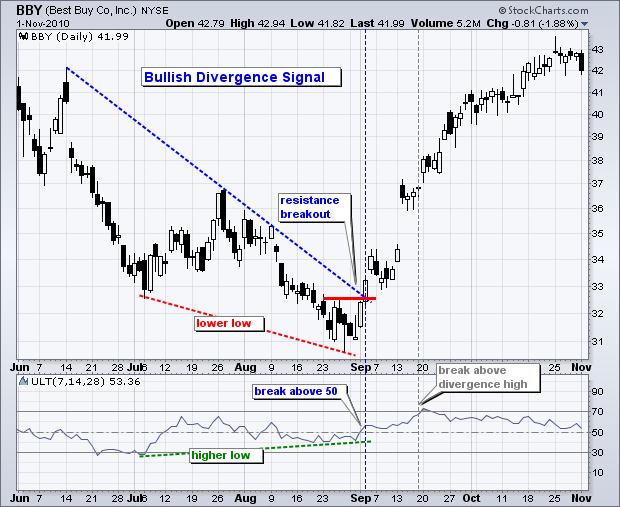
I can tell you from personal experience that the RSI indicator works better for long term overbought and oversold price levels; it tends to be less prone to false signals and works great for divergence analysis. When you are trading short term stock trading strategies that require analysis of market tops and bottoms, I highly suggest using the RSI. The Stochastic on the other hand tends to work better with short term market swings that are not meant to signal market tops or bottoms but only a slight change or a correction in the trend. If I had to characterize the main difference between the two oscillators, I would say the RSI is great for market tops and bottoms and divergence and the Stochastic works great with typical pullbacks retracement strategies.
Find A Stock Thats Trending Or Sloping Strongly Either Up Or Down
You can either do a quick visual analysis or use one of several indicators I previously demonstrated to find a stock thats trending strongly either up or down. Here is a good example of the type of trend you should look for when looking for trading opportunities.

Look For Stocks That Have Strong Trends Going Either Up Or Down
You Need To Modify The Settings On The Stochastic Oscillator
Traditionally, the Stochastic Oscillator is set for long term market analysis. When I say long term I dont mean months or years; long term is anything over 14 trading days or roughly 3 weeks of time. The standard settings on the stochastic oscillator are set to 14 and 3. The 14 period is the slow period and the 3 period is the fast period. What I prefer to do is adjust the slow period from 14 to 5. I find that most short term stock trading strategies tend to respond better for short term pullbacks or price retracements.


