Sharpe Ratio Limitations
Post on: 16 Март, 2015 No Comment

Wouldnt it be great if there was a way to quantify the risk and reward associated with a given system? We could then use that number to compare systems. This would give us an efficient method of ranking systems so we could simply find the best system and trade that one exclusively. However, as with most things in life, it just isnt that simple.
The Sharpe Ratio attempts to provide us with a number that we can use to compare trading systems based on the risk/reward that their backtested results provide. While the goal of the Sharpe Ratio is helpful in theory, it can also set us up to make some misguided decisions. There are many limitations that come into play when using the Sharpe Ratio. It is important to understand how they can affect the perceived value of a trading system.
Limitations
Looking Backwards
The most blatant limitation of the Sharpe Ratio is that it is completely based on backtesting results. Therefore, the ratio is only going to be as good as the backtesting data that was used to calculate it. In a previous post, I covered many of the biases that can affect backtesting data. Because of their close connection, these same biases can skew Sharpe Ratios as well.
Also, as with any backtesting data, we have to keep in mind that all of the data we are using is based on historical returns. There is absolutely no guarantee that these returns will look similar when exposed to future markets. When using indicators derived from past data we must remember that we are making an assumption that future returns will look similar to past returns. If the markets were to fundamentally change, our numbers would be worthless.
Tail Risk
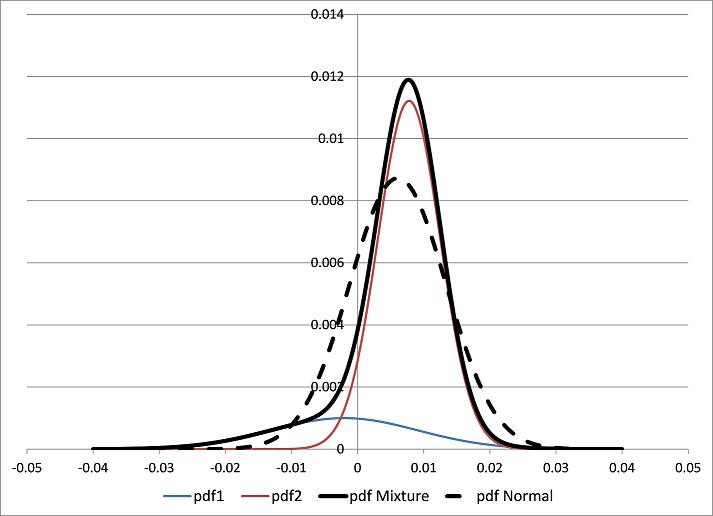
Another limitation of the Sharpe Ratio is that it assumes that returns are normally distributed. Anyone who attempted to trade in 2008 is well aware that this is not the case in the real world. Actual markets are far more susceptible to distributions with fat tails than their theoretical counterparts.
Because of this, the Sharpe Ratio will not give enough respect to the possibility of black swan events wiping out an account. The ratio will be skewed to show better results for systems that are exposed to this type of risk, making them appear safer than they actually are. We need to keep in mind that black swan events happen far more often than statistics say they should. A good system should plan for this.
Transaction Costs
As is the case with many types of system analysis, the Sharpe Ratio is often calculated without taking into account transaction costs. Therefore, it can fall victim to favoring high-frequency strategies that could never be traded profitably due to their high transaction costs. It is important to factor transaction costs into any type of system analysis.
No matter what type of system you are attempting to analyze, it is important to remember that your calculations and projections are only going to be as good as the data they are based on. Calculations like the Sharpe Ratio can be a tremendous advantage for a trader that knows how to use them, however you also need to have an understanding of their shortcomings.
About The Sharpe Ratio
The Sharpe Ratio was invented in 1966 by William Sharpe. It attempts to calculate the value of a systems risk/reward ratio by comparing it to a risk-free investment. The ratio is calculated by subtracting the risk free interest rate (generally US T-Bills) from the average rate of return of the system and dividing that number by the standard deviation of the system.
Trading profits and losses are never distributed this evenly.
When calculating the Sharpe Ratio of a system, it is commonly accepted that a ratio greater than one is considered good, a ratio greater than two is considered very good, and a ratio greater than three is extremely good. Most systematic traders who trade their own personal accounts strive for a Sharpe Ratio of at least two.


