S P 500 Operating EPS Estimates Are Too Optimistic and the Market Is Expensive
Post on: 16 Март, 2015 No Comment

Deep value, contrarian, and Grahamite investment
S&P 500 Operating EPS Estimates Are Too Optimistic and the Market Is Expensive
If your valuation models use forward estimates rather than twelve-month trailing data, youre doing it wrong. Why? As we discussed in Quantitative Value. analysts are consistently too optimistic about the future. and so systematically overestimate forward earnings figures .
They are consistently, systematically, predictably ignorant of mean-reverting base rates. As we wrote in the book:
Exceptions to the long pattern of excessively optimistic forecasts are rare. Only in 1995 and 2004 to 2006, when strong economic growth generated earnings that caught up with earlier predictions, do forecasts actually hit the mark. When economic growth accelerates, the size of the forecast error declines; when economic growth slows, it increases .
This chart from JP Morgan Asset Management as of a week ago shows the chronic overestimation of operating earnings :
The chart comes via Zero Hedge, where they ask, Is the market cheap? My answer is not on the basis of the Shiller PE, which stands at 23.7 versus the long run arithmetic mean of 16.47 or around 40 percent overvalued. Neither is it cheap on the basis of Tobins q. Smithers & Co. has it at 44 percent overvalued on the basis of q. and they note:
As at 12th March, 2013 with the S&P 500 at 1552 the overvaluation by the relevant measures was 57% for non-financials and 65% for quoted shares .
Although the overvaluation of the stock market is well short of the extremes reached at the year ends of 1929 and 1999, it has reached the other previous peaks of 1906, 1936 and 1968.

How about the single year P/E ratio as reported. The S&P 500 TTM P/E stands at 18 versus the long run mean of 15.49. But its cool because the E is growing, right? Err, no. The E peaked in February last year (see Standard & Poor’s current S&P 500 Earnings. go to Download Index Data, and select Index Earnings). The multiple will now have to expand just to keep the market where it is. You have to do these sort of acrobatics to get it going up:
Margins are now going to bounce free of the wreckage like those few lucky souls who remember to assume the brace position before the plane hits the ground. even though the as reported rolled over a year ago (I hope Denzel Washington is flying this plane).
So how is it cheap?
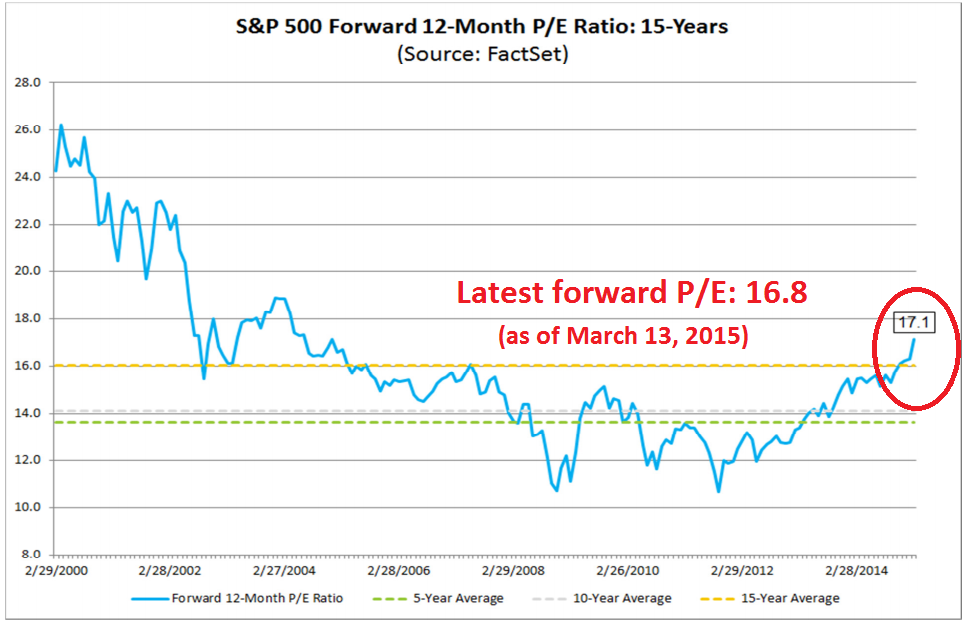
Its at 14.5 on the basis of twelve-month forward operating earnings estimates versus a long run mean of 15.49. You gotta do what you gotta do to get the Muppets to buy.


