Reports on Stock buy & sell Signals for Moving Average System
Post on: 29 Март, 2015 No Comment

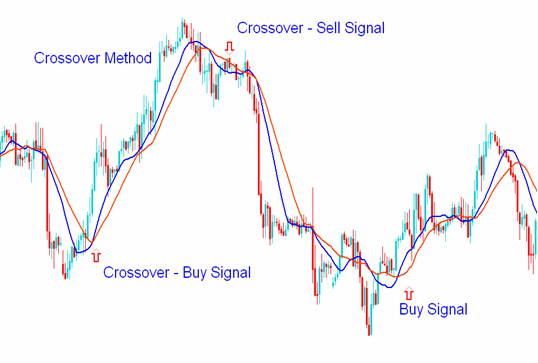
Stock signals: alerts of R.C. Allen’s Triple Moving Average Crossover strategy.
You Might Also Find These Items to be of Interest
1. A free list of the highest-momentum stocks in our database is at Momentum List
2. A free list of stocks that just surged in price and volume is at Surges
3. A free list of stocks making new highs is at New Highs
4. A free market review and daily updates of market indicators are at Market Indicators
We also have other alert systems. For example, you may see a description of the alerts currently included in the StockAlerts subscription, by clicking on C urrent alert list.
The R.C. Allen 4-9-18 Moving Average Crossover Discipline
To get a short summary or to order a subscription click on the Products & Prices link (third from the top) on the top left of your screen and then select Stock-Scanner. R.C. Allen’s system is a complete buy and sell system.

Alerts are alerts . They are not buy or sell signals. An alert means analyze this. When one of our screens flashes an alert, it means only that certain setup conditions have been satisfied. In this case, It means that the 4-day moving average has crossed above both the 9-day moving average and the 18-day moving average and also that the 9-day moving avertage has crossed above the 18-day moving average. It may also mean that the 4-day moving average has crossed below both the 9-day moving average and the 18-day moving average and also that the 9-day moving avertage has crossed below the 18-day moving average. That does not mean that all setup conditions are satisfied for a purchase or short sale. For example, there may be overhead resistance that only the human eye can detect. Therefore, inasmuch as an alert means only that a single set of conditions has been satisfied, the logical response to an alert is to make a visual inspection of the stock’s chart. Look for reasons to avoid taking action. For example, if the alert is an Up Alert, look for reasons to avoid buying. One reason would be overhead resistance not far above the current price. For example, if the Up Alert occurs when the price is $45 a share, but the chart shows that the stock has declined on the 5 previous times when it reached $47, then you know there is overhead resistance at $47. The chances are high that it will do so again. Therefore, it might be wise to wait and see if the stock can rise above $47 and stay there a few days before buying. If you can find anything that makes you wary or uncomfortable, it would be rational to walk away.
Our algorithm identifies the stocks in a database of approximately 8000 stocks that have generated a signal according to R.C. Allen’s 4-, 9-, and 18-day triple moving average crossover system (see Trading This System below). The system featured here was made popular by R.C. Allen (How to Build A Fortune in Commodities ) as an effective tool for trading both stocks and commodities. However, even R.C. Allen did not consider the signals generated by his system to be buy or sell signals in their own right in isolation from their context. He simply argued that the commencement of a trend could be traded correctly by waiting for these averages to align themselves in a particular way. It may help to think of these averages as currents of momentum. When the momentum currents build to a certain level, an alert is generated. There is a specific alignment for the commencement of a downtrend and another specific alignment for the commencement of an uptrend. Of course there are considerations other than these alignments.
Subscriber lists of R.C. Allen setups are ranked according to the magnitude of the volume surge on the day of the signal. The greater the surge in volume at the time an alert is generated, the more likely it is that the stock will follow through with a continuation of th e move. Up to 90 top-ranked R.C. Allen crossover signals are posted for subscribers. Also, t he direction of the 4-day moving average is provided because its direction might be significant when an alert has been generated, and some people might want to consider that as a factor when evaluating a stock. That is, some traders who use allen’s system use the direction of the 4-day moving average as a kind of warning system. If there has been an Up Alert, the individual may decide not to buy if the 4-day moving average is declining. A declining 4-day moving average may be a warning that the last signal may be a whip-saw. It indicates the beginning of a minor counter-trend to the trend that caused the signal. Such traders will wait for the 4-day moving average to be rising again (while the other moving averages are still aligned correctly) before buying.
This algorithm gives a signal the day it occurs, but it is designed to continue listing a stock for several days after the initial signal. Originally, we had a separate subscription for R.C. Allen Alerts. The headings of the list we generated included Sym, Price, Av $/Day, Vol%, RSI, 4-Day MA, and Alert [Up or Down]. We have now merged this alert system with the Stock-Scanner. All the headings are still there. However, The Stock-Scanner has other alerts as well.
Reports Are Issued Daily


