Relative Strength Index what is rsi rsi indicator
Post on: 8 Июль, 2015 No Comment

- Using Relative Strength Index for technical analysis.
- Actual example of how to make profitable trades.
- Understand Divergence and Failure Swings within RSI.
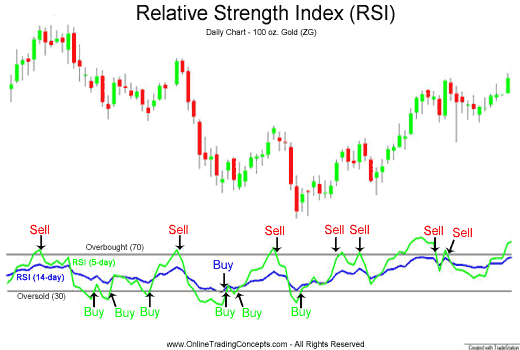
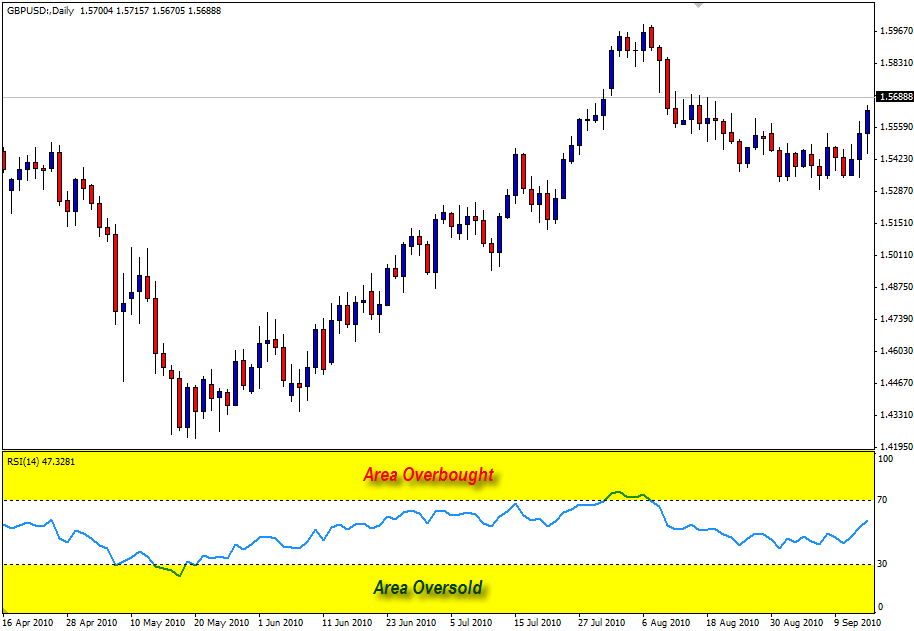
Relative Strength Index (RSI) is a technical analysis tool which is used to measure the changes in price momentum of a security. It is a momentum oscillator and moves between a range of 0 and 100. However the general range of this indicator is between 30 and 70. If a security exceeds 70 on RSI tool it shows that the security is overbought and when it is below 30 it signifies an oversold situation. It is most powerful when used in combination with other tools to give ideal entry/exit points for a trade.
What is RSI
RSI gives indication of overbought and oversold positions
Relative Strength index formula: 100- 100/ (1+RS)
RS= Average of last x days up closes/ Average of last x days down closes
Let’s look at an actual example:
Fig 1: Google’s price movement in the past six months. Generally the RSI indicator shows a movement in the range of 30-70. However it goes out of this on October 17, 2014 and again on December 16, 2014 showing oversold positions. (See: Google stock analysis )
When the stock price movement is outside the range of 30-70 it gives a strong signal of oversold/overbought positions. In the case of Google (NASDAQ:GOOG). when the RSI indicator goes below 30 point mark on October 17 there is a strong pullback in the Google price. Using RSI for entry/exit points can provide a good trading tool to profit from these sudden pullbacks.
During sustained bullish periods the indicator will show an upward shift and there will be numerous crossings of the 70 point mark. Similarly during a bearish period there will be a downward shift giving higher number of crossing on the 30 point mark.
Fig 2: Apple stock price and its RSI for past 8 months. (See: Apple stock analysis )
Apple (NASDAQ:AAPL) has shown a sustained bullish trend in the past 8 months where the Apple share price has increased by more than 65%. The RSI indicator shows multiple crossing of the 70 point mark during this time. During a long bullish trend the final trading strategy would have to be modified as the pullbacks in the price level take place at a higher RSI level. Similar modification need to be done at bearish trends.
Divergence Within RSI And Price Level

A major indicator of a change in price momentum is by noticing a divergence in the chart. During bullish trend this happens when the price level shows a higher high whereas the RSI indicator chart shows a relative lower high for respective prices.
Fig 3: HP stock price movement in the past three months. (See: HPQ stock analysis )
We can see that after reaching a peak at point 1 the Hewlett Packard (NYSE:HPQ) stock reaches a higher high on the price level at point 2. However in the RSI index the same price change shows a lower high from point 3 to point 4. This is an indicator that the upward momentum is near an end and it can be a good point to exit the stock.
A similar divergence in the bearish trend will be seen when the price level of the security reaches lower low however the RSI chart shows a higher low indicating an end to the bearish trend.
Failure Swing
Another major indicator within RSI chart is Failure Swing. Here only the RSI chart is analyzed and the stock price movements are not important.
Fig 4: Amazon stock price movement and its corresponding RSI chart. (See: Amazon stock analysis )
In the above figure, RSI falls below the 30-level mark at point 1 for Amazon (NASDAQ:AMZN). There is a pullback and the RSI rises to point 2 also called as fail point. There is another fall in the indicator to point 3 however this time it fails to breach the 30-level mark. There is an instant pullback in the RSI and point 4 is the point where an actual buy decision should be made. Point 4 is at the same level as the fail point arrived earlier. Any breakout at point 4 will show a sign of reversal of trend and a good entry point to buy the stock.
We can also see in the Amazon price graph that after breaching point 4 on the RSI chart the price momentum is strongly bullish for a considerable period. This will help in giving high profits and at the same time give much lower probability of wrong signals.
A similar mirror image is developed when the RSI hits 70 point mark. After falling below the fail point in the graph it will show a bearish trend.
Conclusion
To gain success within RSI tool one much be adept at recognizing failure swings, divergences and other trading signals within the tool. At the same time it is also helpful to use other tools like MACD for confirmation of signals. This leads to higher success rate and greater profit margins within trading.
Disclaimer: The views expressed in the article are of individual authors and are not necessarily supported by Amigobulls. We do not hold any stake in the aforesaid stocks. Please read our detailed disclaimer .


