Relative Strength Index (RSI)
Post on: 16 Март, 2015 No Comment

Relative Strength Index (RSI)
9/22/2013
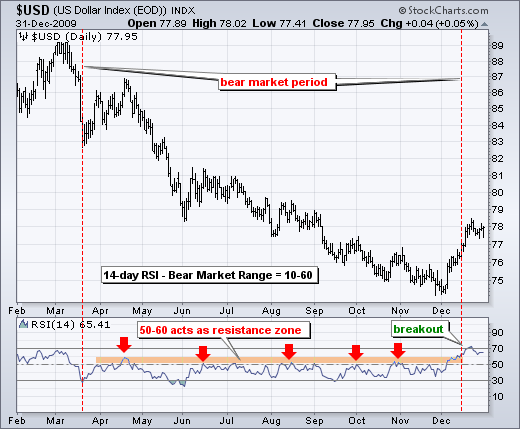
The Relative Strength Index (RSI) is another of my favorite market indicators. It’s an oscillator because it travels back and forth across a center line with a maximum of 100 and a minimum of zero. The RSI is considered overbought when the RSI is above 70 and oversold when the RSI is below 30. The default setting on the RSI is 14 periods. For me I find that the default setting is too slow so I normally use a setting of 10 periods. By decreasing the number of periods I in essence increase the volatility of the oscillator which in turn provides me with more signals. The disadvantage is that it also increases the number of false signals. This is really a personal preference determined by each individual investor.
If you’d like a more thorough explanation of how the RSI is calculated, please see the article in StockCharts.com titled Relative Strength Index. It goes into great detail on the calculation and use of this indicator. The way I use this indicator is as a confirmation of other indicators, specifically my favorite indicator, the MACD. As the RSI indicator moves into overbought or oversold territory it provides me with a signal that the stock that I’m looking at is in an extreme trading area. It has either been pushed too high or too low by investors. That alone is not a buy or sell signal for me, it just tells me that the stock has been or is being pushed in one direction or another. What I look for is a turn in the direction of the indicator.
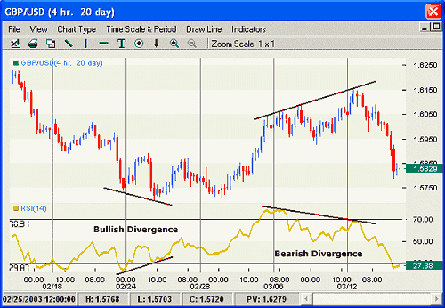
In the case of a stock I am interested in buying and has become so oversold that the RSI has fallen below 30, I wait and watch until the indicator begins to turn up and move above the 30 line. The reason for this is that I have learned over the years that stocks that are oversold with an RSI below 30 can remain below 30 and continue to go lower for some additional time. I really don’t want to buy a stock until it has completely exhausted all of it’s downside pressure. I want to buy stocks as they turn and start to move back upward. The result of this strategy is that I rarely buy at the exact bottom. It’s usually a day or two later. The other option would be to buy earlier and watch my investment continue to fall while the stock looks for a bottom. That’s not a desirable situation for me financially.

The opposite occurs when I’m seeing one of my stocks topping. Simply going above the 70 line is not an automatic sell signal for me. I’ve learned that stocks can continue to move higher for quite some time after moving above the 70 line. Once again I look for the turn in the indicator as it rolls over. The result is I never sell at the very top but instead a day or two later. The other option would be to sell earlier and have the stock continue to rise causing me to be out of a stock I had owned. This is not maximizing the efforts I initially put in to discover the stock in the first place, and it’s contrary to the old adage of letting your winners run.
As with the previous posting on MACD I realize at times I’m not smart enough to absorb all the information in a written explanation like the one in StockCharts.com so I’ve included below a video explaining the RSI from the website PerfectStockAlert.com that provides an excellent visual explanation. I hope you enjoy the video.


