Relative Strength Index (RSI)_1
Post on: 2 Июль, 2015 No Comment

RSI
What does it all mean? The Relative Strength Index (RSI) was developed by J. Welles Wilder in 1978 as a stand-alone trading system in his book, New Concepts in Technical Trading Systems. Relative Strength Index charts the present and past strength/weakness of any financial asset, irrespective if this is a share, stock market index, currency pair, commodityetc. In essence the RSI warns when price action is overbought (has risen too much) or oversold (fallen too much) and can be applied to any market, including stocks, forex and commodities.
How does it work? The RSI is a momentum oscillator which calculates the speed and size of directional price movements. The term Relative Strength Index is somewhat a misnomer, because relative strength is the term used when comparing, for instance, a stock to the market index, or to the market sector. The RSI is basically an overbought or oversold indicator; it is a measure of whether a market has gone too far, too fast, in one particular direction and is now running out of steam. Buy signals generally occur when crossing the 30 level and sell signals when crossing the 70 level.
The RSI does not compare two separate values, it simply compares a stocks relative strength to previous values of the same stock; in other words it is a measure of the present and historical strength of a market. It is calculated by comparing it with the average upward price change with the average downward price change over a set period. The RSI compares the average of up and down closes over a defined time, typically 14 periods.
The relationship between average up and down closes is normalized by Wilder’s formula, converting the relationship into an oscillator that fluctuates between zero and 100. The RSI is considered a “momentum oscillator” because it measures the rate of the change in price. So in a nutshell the indicator is a measure of the momentum of upward and downward movements in price. So stocks that have experienced a strong rally over a short period in time have a higher RSI ratio than that do not.
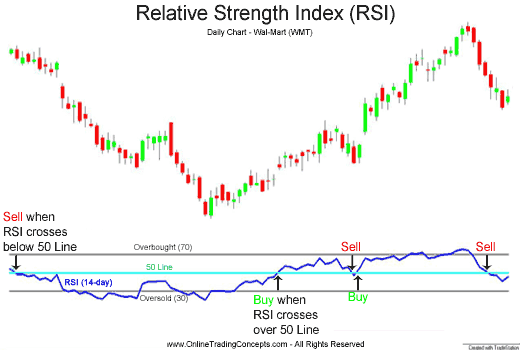
Heres the chart with the RSI underneath: –
When prices move up or down rapidly, a market can either become overbought or oversold signalling a possible reversal. The RSI follows the price and is plotted against a scale from 0 to 100, as can be seen. The stock is considered oversold when it falls below 20 to 30, and is overbought if over 70 to 80. It’s generally regarded to be a buy signal when the RSI rises up from a low point and crosses the 30 line, and a sell or short signal if the RSI was up high and drops down through 70. An RSI of 50 is neutral. RSI can also be charted and used in conjunction with other charts in identifying zones of support, resistance and trends.
As we have said when the RSI drops to 30 or lower the measured instrument is considered oversold, and at values of 70 or higher, is overbought. In the EUR-USD chart above you can see the relationship between price momentum, measured by the RSI, in blue along the bottom, and price action, measured by a 1-day moving average (i.e. closing price – the input price used to calculate the RSI) as the yellow line above it.
During periods of strong trending action the RSI can spend significant lengths of time at overbought or oversold conditions depending on the direction of the trend.
So what are the signals to look for? There are a number of approaches traders can take to using the RSI. At its simplest are signals generated when the RSI moves out of oversold or overbought conditions. In the case of the former, a buy (or cover) signal is generated when the RSI crosses above 30. In the latter, a sell (or short) signal is created when the RSI crosses below 70.

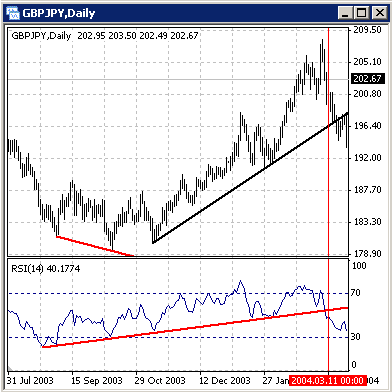
But these are not the only tactics available to users of the RSI. Divergences between the RSI and price can give warning of an upcoming price reversal. As with price action, the RSI moves in zig-zag form, making spotting divergences relatively easy. When price makes a sequence of lower lows (in a down trend) its possible for the RSI to be doing the opposite – making higher lows, referred to as a “bullish divergence”. This divergence is a warning sign the momentum in price is changing and traders should be positioning themselves for a change in trend. The reverse is true in an uptrend, in a “bearish divergence” the RSI starts making lower highs as price makes higher highs, suggesting the strength of the rally is waning. There are also “positive divergences” when the RSI makes a lower low but price makes a higher low coming out of a down trend, this is bullish. Likewise, a “negative divergence” occurs when RSI makes a higher high but price makes a lower low in an uptrend, this is bearish. There are subtle differences between the various divergences which at first appear to conflict – but with a chart in front of you they make more sense. However, there is a caveat to divergence. Divergences in strong trending markets can last weeks – sometimes months – before underlying price action changes.
A third use of the RSI is the ‘failure swing’. Failure swings are independent of price action and occur at the crossover oversold (30) and overbought (70) zones. In a bullish failure swing the RSI crosses above 30 (as in the basic trigger), pulls back to just above 30, then moves higher – pushing past the last peak of the RSI in a breakout. The reverse happens in a bearish failure swing at the 70 mark.
Constance Brown in 1999 added a little twist to the RSI; instead of using the default 30 / 70 to mark oversold and overbought levels she looked to 40 / 90 as reversal thresholds for a bull market and 10 / 60 in a bear market.
As with other oscillators, it is important to see if the RSI is going in a different direction from the price, which is called divergence. This tends to show a lack of strength in the price, which you can expect to revert to its previous level. In this way the RSI will give you early warning of a change in price direction.
When do I make my move? Like the majority of momentum oscillators, RSI works best when prices are moving sideways inside a range. Sideways markets can be found when short-term moving averages (MAs), like 5- or 10-day simple MAs, flatline and/or generate a large number of crossovers in a short space of time. In environments when trending methods fail, momentum tools are at their strongest.
Trader note: RSI is obviously unreliable on its own, but when used in conjunction with support and resistance it helps me identify extreme levels to the upside or downside and potential reversals. Through my eye for instance at the time of writing (March 2012) the Dow has leapt ahead of the FTSE, it is at pre crisis highs and it is in a resistance area. Combine this with my RSI indicating overbought, I think its going down from here. If GDP disappoints I’m likely to open a short. If Im wrong I will lose cash, if Im right I hope to make more than I will lose.


