Rate Of Change of Price (ROC) stock market stock trading day trading penny stocks stock
Post on: 30 Май, 2015 No Comment

RATE OF CHANGE OF PRICE (ROC)
Rate Of Change of Price (ROC) gives the price change in a particular fixed time change. The difference can be display same point or percentage
Description :
Rate Of Change (ROC) directly propose to price, It mines as stock price increase Rate Of Change of Price (ROC) increased & as stock price decreased Rate Of Change of Price (ROC) decreased.
Time period is important factor for Rate Of Change of Price (ROC). The most popular time frame is 12 and 25 days. The 12 days period is best to find stock market are over bought or over sold, for short term & intermediate term. Higher Rate Of Change of Price (ROC) indicates stocks are overbought & Lower Rate Of Change of Price (ROC) indicates oversold stock position.
Normally when stocks comes in oversold position it indicates it’s ready to move up side & in overbought position stock price normally come down.
How to Calculate?
Here we calculate 12 days ROC
1) Take Today’s Close Price (say “A”)
2) Take 12 days before Close Price (say “B”)
ROC=[(A-B )/B]*100

The Rate Of Change of Price (ROC) oscillator fluctuates above and below the zero line. Values of ROC are always between 0% and 100%.You can buy stock when you see ‘s positive divergence & sell with negative divergence.
Momentum : Momentum is the measure of speed and breadth of progress or regress in a stock market. Speed is measured by Rate Of Change of Price (ROC) and breadth is determined by the number of stocks advancing minus the number of stocks decling on a daily basis continuouslly added to a running toatal. Here we looking net stock participate to major trend.
Rate Of Change of Price (ROC) always show one or more lower peaks when market prices arrives near the top. When the stock market in overbought condition in middel of major trend, all or most Rate Of Change of Price (ROC) hits new highs. Any time Rate Of Change of Price (ROC) retreats to modrate oversold zone after an extreme overbought condition, that indicates stock market are ready for another significant advance.
Divergence in the Rate Of Change of Price (ROC):
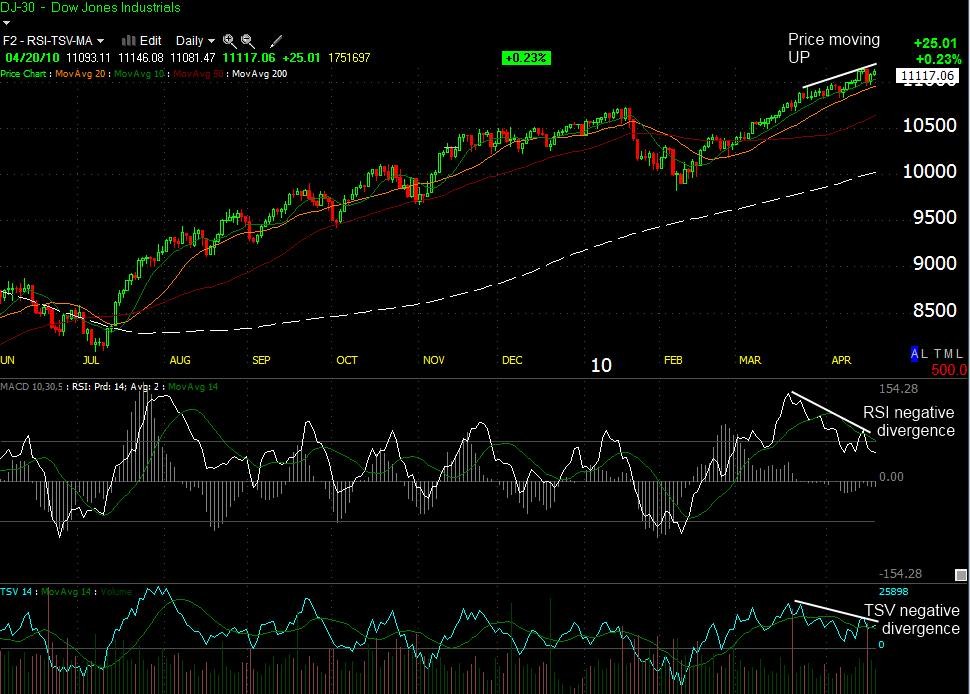
A lower peak in the Rate Of Change of Price (ROC) against higher highs in the stock market called negative divergence and typically it’s a Sell signal.
A higher peak in the Rate Of Change of Price (ROC) against lower lows in the stock market called positive divergence and typically it’s a Buy signal.
To get good result with Rate Of Change (ROC) we need to use it with other technical indicators like Moving Average (MA) | On Balance Volume (OBV) | Percentage Price Oscillators (PPO) | Relative Strength Index (RSI) | Stochastic Oscillator (STO) | Commodity Channel Index (CCI) | Chaikin Money Flow oscillator (CMF). When we use two or three technical indicators and in case of positive divergence and negative divergence it giving real good result, only you need to change time span and find out which is a better pair for you.


