Pyramid Your Way To Profits
Post on: 17 Июль, 2015 No Comment

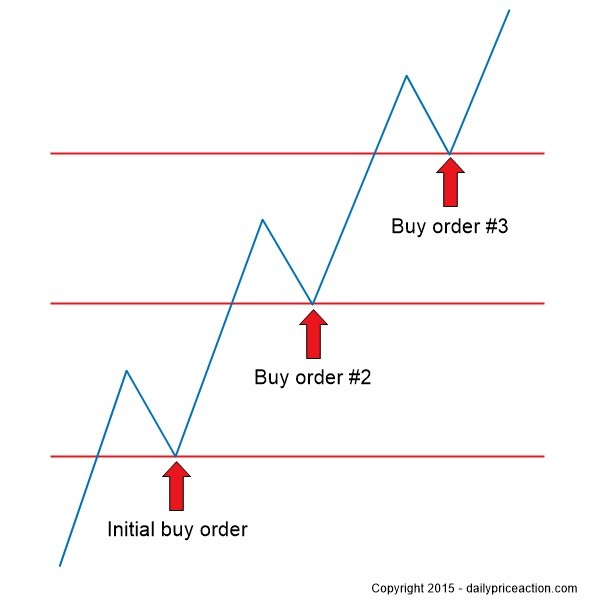
Pyramiding involves adding to profitable positions to take advantage of an instrument that is performing well. It allows for large profits to be made as the position grows. Best of all, it does not have to increase risk if performed properly. In this article, we will look at pyramiding trades in long positions. but the same concepts can be applied to short selling as well.
Misconceptions About Pyramiding
Pyramiding is not averaging down , which refers to a strategy where a losing position is added to at a price that is lower than the price originally paid, effectively lowering the average entry price of the position. Pyramiding is adding to a position to take full advantage of high-performing assets and thus maximizing returns. Averaging down is a much more dangerous strategy as the asset has already shown weakness, rather than strength. (For further reading, see Averaging Down: Good Idea Or Big Mistake? )
Pyramiding is also not that risky — at least not if executed properly. While higher prices will be paid (in the case of a long position) when an asset is showing strength, which will erode profits on original positions if the asset reverses, the amount of profit will be larger relative to only taking one position.
Why It Works
Pyramiding works because a trader will only ever add to positions that are turning a profit and showing signals of continued strength. These signals could be continued as the stock breaks to new highs, or the price fails to retreat to previous lows. Basically, we are taking advantage of trends by adding to our position size with each wave of that trend.
Pyramiding is also beneficial in that risk (in terms of maximum loss) does not have to increase by adding to a profitable existing position. Original and previous additions will all show profit before a new addition is made, which means that any potential losses on newer positions are offset by earlier entries.
Also, when a trader starts to implement pyramiding, the issue of taking profits too soon is greatly diminished. Instead of exiting on every sign of a potential reversal. the trader is forced to be more analytical and watch to see whether the reversal is just a pause in momentum or an actual shift in trend. This also gives the trader the foreknowledge that he or she does not have to make only one trade on a given opportunity, but can actually make several trades on a move.

For example, instead of making one trade for a 1,000 shares at one entry, a trader can feel out the market by making a first trade of 500 shares and then more trades after as it shows a profit. By pyramiding, the trader may actually end up with a larger position than the 1,000 shares he or she might have traded in one shot, as three or four entries could result in a position of 1,500 shares or more. This is done without increasing the original risk because the first position is smaller and additions are only made if each previous addition is showing a profit. Let us look at an example of how this works, and why it works better than just taking one position and riding it out.
Real-World Application
For simplicity, let’s assume we are trading stocks for our first example, and have a $30,000 trading account limit. The maximum we want to risk on one trade is 1-2% of our account. Using a 1% maximum stop, in dollar terms we are only willing to risk $300. A stop will be placed on the trade so that no more than this is lost. We look at the chart of the stock we are trading and pick where a former support level is. Our stop will be just below this. If the current price is 50 cents away from the last support level and we add a small buffer (so, 55 cents), we can take 545 shares ($300/$0.55=545). Round this number down and only take 500 shares; our risk in now less than $300.
We could buy our 500 stocks and hang on to them, selling them whenever we see fit, or we could buy a smaller position, perhaps 300 shares, and add to it as it shows a profit. If the stock continues to trend, we will end up with a larger position (and thus more profit) than 500 shares, and if the stock falls we only lose money on 300 shares — a loss of only $165 ($0.55*300) as opposed to $275 ($0.55*500) if we only took a static 500 share position.
Now, let’s take a look at an example using a 15-minute chart of the Great Britain pound against the Japanese yen (GBP/JPY). The circles are entries and the lines are the prices our stop levels move to after each successive wave higher.


