Price to Earnings Ratio P
Post on: 15 Июль, 2015 No Comment

What is the P/E Ratio?
The P/E ratio is the price to earnings ratio for a company. This ratio is meant to communicate to the investor the true value of a stock. The P/E is sometimes referred to as a price multiple, because it shows how much an investor is willing to pay per dollar of earnings.
P/E Ratio Formula
For example, if a stock is trading at $100 with and EPS of $5 the P/E ratio would equal 20 ($100/$5). The market value per share is merely the stock price while the earnings per share is a figure which tells you just that; this calculation refers to the amount of money shareholders would receive if a company decided to distribute all their earnings for a specific period. EPS can be found on the income statement .
Interpreting the P/E Ratio
The P/E ratio is one of the core components of fundamental analysis. Every company traded on the major indices is required to report quarterly earnings reports. A company’s P/E ratio is one of the key values for value investors. A high P/E ratio implies a company is not making much money per share, while a low P/E ratio implies that a company is operating efficiently. If it were this easy to evaluate the P/E ratio, we could all just simply buy stocks with low p/e ratios andimplement a buy and hold strategy. In reality a P/E ratio must be analyzed over a number of basic factors. The major flaw of the P/E ratio is the earnings per share calculation (EPS). The EPS is quantified by the company when reporting earnings. This can be a tricky process depending on how a company reports gains and losses. We all remember the Enron scandal, where the company was able to maintain a low P/E ratio, while covering up the financial issues that ultimately lead to the company’s demise.
Below are a few rules of thumb when analyzing a P/E ratio:
- What is the average P/E ratio of the broad market? Sometimes P/E ratios which are considered over or undervalued historically, may not be based on the current market envrionment.
- What is the average P/E ratio for the sector the stock trades in? Obviously P/E ratios for technology companies will be much higher because of the growth potential. Investors are always willing to pay more for the hopes of a higher return.
- How does the P/E ratio compare to the stock’s historical performance? If the stock’s P/E ratio has been 20 for 30 years, and now is at 10, the stock is more than likely undervalued.
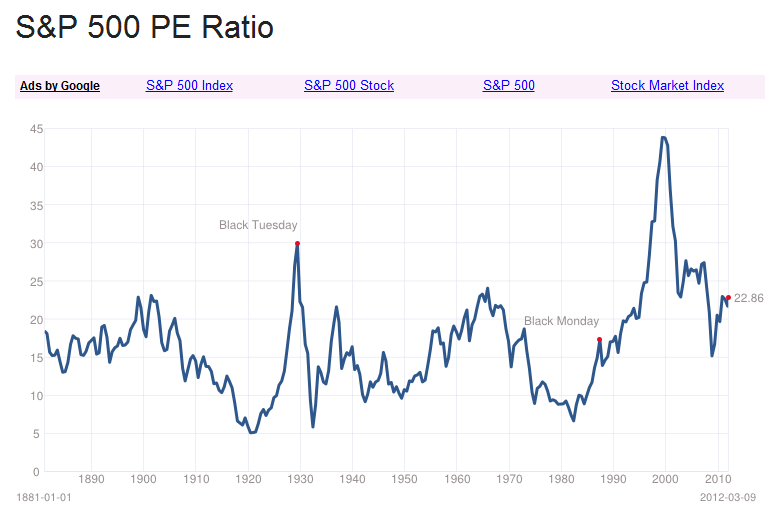
Historical Graph of S&P 500 P/E Ratios
Historically stocks have had a P/E ratio of 15. This does not mean the market can not trade with P/E values of 30 or higher, but at some point stocks will come down from these lofty levels. One can only live off the prospect of making money for so long, anyone remember the internet bull market? Below is an historical chart of the P/E ratios for the S&P 500.


