Portfolio Optimization
Post on: 16 Март, 2015 No Comment

Portfolio Optimization calculates optimal investment weightings for a basket of financial investments that gives the highest return for the least risk. Results display action required and probability analysis through Monte Carlo simulation
Portfolio Optimization is an Excel spreadsheet-based Monte Carlo software designed to test for the optimum selection of investments and weights in an investment portfolio.
This portfolio optimization software features a variety of capabilities far beyond a simple spreadsheet or what if scenario based application. The key features of the portfolio optimizer software include:
How the Portfolio Optimization Software Works:
Portfolio Optimization determines the optimal mix of financial assets based on the efficient market hypothesis.
An overview dialog in the portfolio risk software allows you to specify all inputs for running the model.
Financial data can be entered or copied into the input sheet.
The portfolio optimizer includes an automatic Download data from Internet tool. Just enter a ticker symbol and it will copy historical prices directly into the data worksheet.

A parameter is included in the portfolio software to ensure the simulated return of the portfolio is at least as high as the existing portfolio. Return period, min and max constraint weighting, and current units can be adjusted and used as a baseline for the simulation.
The software automatically calculates correlations between the securities or businesses tested. You have the option to modify the correlation matrix before running your simulation. You can set correlations of absolute returns or percentage returns.
The correlation matrix shows automatically calculated statistical correlations between different products or businesses. You can modify the correlation matrix before running the simulation to test different diversification scenarios.
Execute the analysis and run the optimization using the various inputs you have specified.
Analyze the results: Current portfolio is on the left, optimized on the right. Monte Carlo simulation histogram distributions of returns, mean, standard deviation, Sharpe Ratio, and probability of achieving the target with the portfolio are all displayed below.
Theoretical % weighting, theoretical change in return according to the portfolio change, and the optimal weighting and units per investment are all shown in the Results screen.
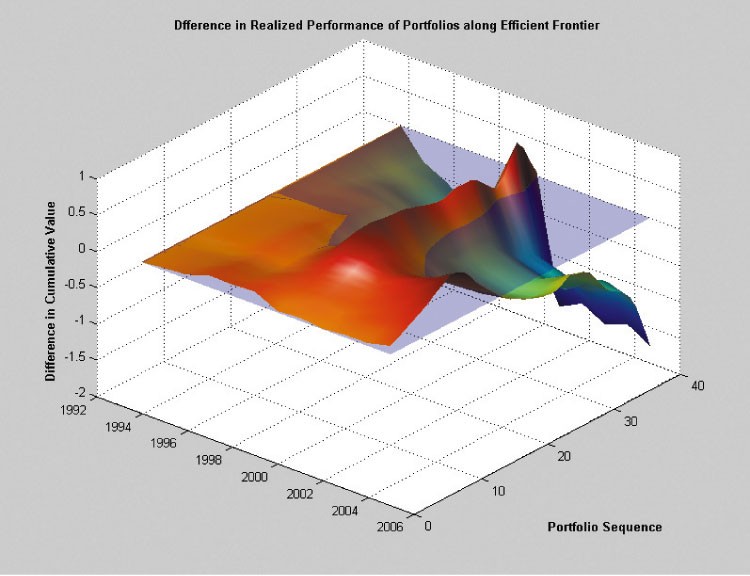
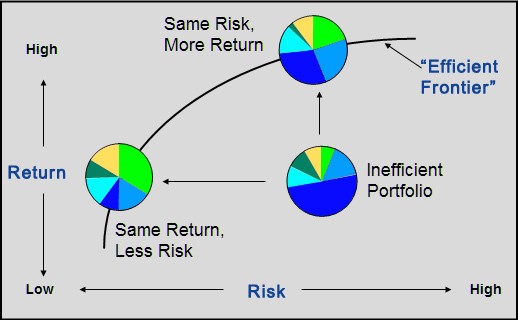
View the optimized portfolio simulation results versus the Efficient Frontier.
Help menus are available for all operations, functions, and methodologies used.


