Permanent Portfolio Performance and Historical Returns
Post on: 22 Июль, 2015 No Comment

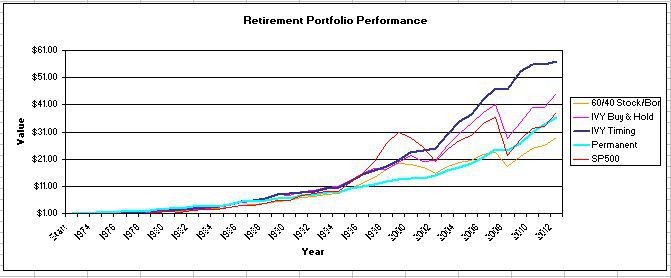
Lets get to the meat the Permanent Portfolio performance: How well does it actually work? The answer is that the Permanent Portfolio has performed very well over the last 40 years. These and other topics are all covered in the new book.
In a prior post we talked about the Permanent Portfolio allocation which is:
25% Stocks (in a broad based stock index fund like the S&P 500)
25% Long Term Treasury Bonds
25% Gold Bullion
25% Cash (in a Treasury Money Market Fund)
This allocation will provide protection when the economy shifts through the cycles of prosperity, inflation, deflation and recession.
Now, some may be thinking that this allocation sounds very different than what theyve seen elsewhere. For instance, the idea of owning gold is scoffed at by some investment advisors because it has no dividends or interest. Long Term Bonds? Many will tell you that theyre too risky due to rising interest rates. How about Cash? Isnt holding a bunch of cash missing out on the hot stock market action? And, only 25% in stocks? Well everyone knows that stocks always beat every other investment so surely you want more than 25%, right? Right!?
The reality is the investment markets are uncertain and unpredictable. What may look good in a theoretical backtest may blow up horribly as economic conditions change. Even worse, portfolio strategies that should work well based history often dont work in actual application as people abandon them due to volatility and long periods of underperformance. Finally, every reputable study on the subject has shown that relying on your gut instinct, hunches, investment gurus and hot tips to run a portfolio is a road to disaster for performance and safety.
The Permanent Portfolio strategy works because it has very wide and true diversification. You have exposure to assets that can grow your money safely at all times without having to predict the future. You also have protection in the diversification against losing large amounts of money which can cause you to abandon the strategy in bad markets.
A Couple Small Changes
I did make two small changes to the original Permanent Portfolio as investment vehicles have changed in type and availability over the years. Harry Browne recommended using the Treasury Money Market Fund for cash. I personally like using Short Term Treasuries in combination with a Treasury Money Market Fund which provides nearly identical risks but slightly better returns on your cash. Also, instead of using the S&P 500 Index. Ive chosen to use the Total Stock Market Index (also called the Russell 3000, or Wilshire 5000 index). The Total Stock Market Index provides wider stock diversification (holds 3-7000 stocks) with slightly better results than the S&P 500 (which holds 500 stocks). The slightly better result is because the Total Stock Market also holds small and medium sized company stocks which can sometimes outperform the large company stocks of the S&P 500 alone. The Total Stock Market also has expected higher tax efficiency due to how the index is constructed and managed.
You can use my changes or not. It doesnt matter much. If you stick to the S&P 500 and Treasury Money Market Fund as originally recommended the results are within about 0.50% (one half percent) annually (favoring short-term bonds and total stock market) through the years.
Historical Returns
Lets look at the score card and see how the Permanent Portfolio Allocation has done from 1972-2011 (1972 is the furthest we have data for Gold which was taken off the fixed exchange rate in 1971). The growth assumes $10,000 starting investment.
The assumption in this table is we rebalance each year to get back to our 25% allocation split among all four asset classes. Percentages are rounded to the nearest tenth.
This table uses the data directly from the Simba Spreadsheet on the Diehards Forum. Some of the numbers are lower than what the Morningstar SBBI yearbook may show for certain assets (such as Long Term Treasury Bonds). However I have opted to use the Simba Data simply because it is widely available to anyone where the SBBI data is not.
Because I am using Simbas data, it will be slightly different than actual returns I post each year that uses Morningstar data and longer term bonds. But the data is close enough that the principal goals of stability and good returns are illustrated regardless. Past performance is no guarantee of future results.
Key:
- Stocks Total Stock Market index
- Bonds Treasury 20+ year long term bonds
- Cash Treasury 1-2 year notes
- Gold Gold bullion
- Losses in Red


